

Expected changes in clinical measures of adiposity during puberty
- PMID: 20864005
- PMCID: PMC3590003
- DOI: 10.1016/j.jadohealth.2010.03.019
Expected changes in clinical measures of adiposity during puberty
Abstract
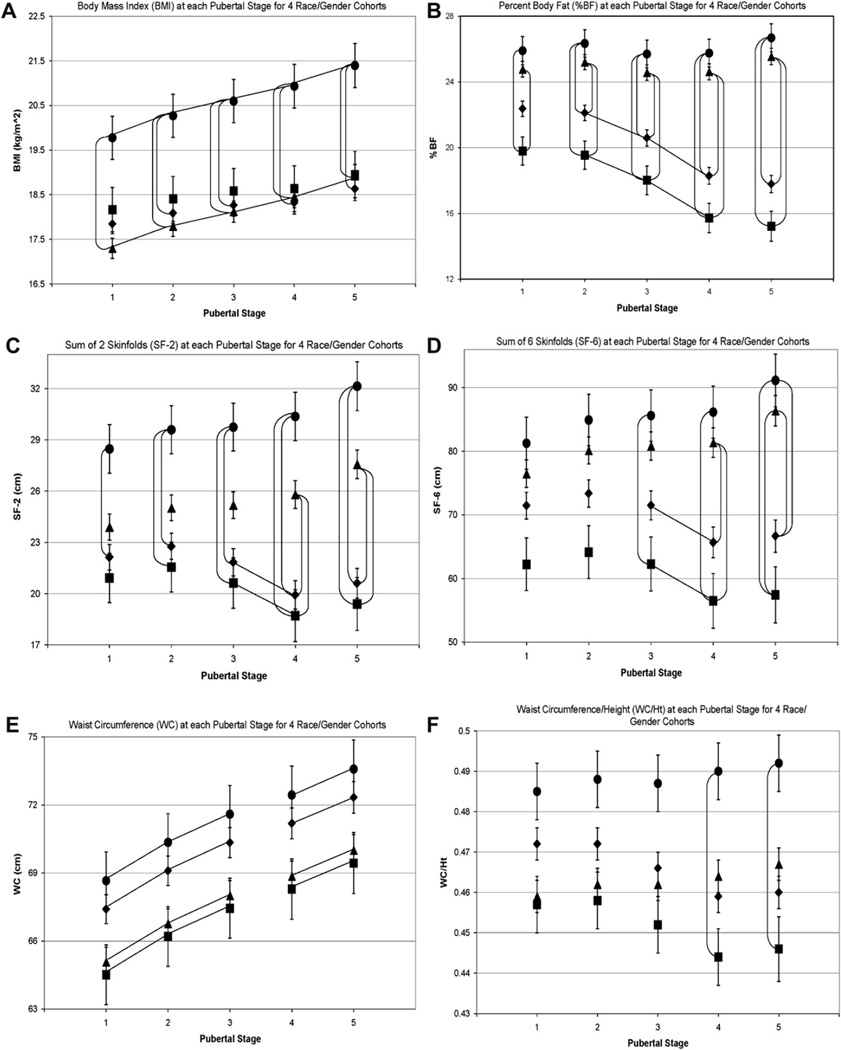
Background: Clinicians use several measures to estimate adiposity. Body mass index (BMI), although not a measure of adiposity, is commonly used to define weight status. Percent body fat (%BF) measures total body fatness, which is composed of central and peripheral fat, estimated by waist circumference (WC) and skinfold thickness, respectively. Abnormal increases in fat during puberty may reflect an increased risk of developing cardiovascular disease. Therefore, it is important to establish the normal patterns of change in clinically relevant measures of adiposity.
Purpose: To describe the normal patterns of change in clinical measures of adiposity during puberty.
Design/methods: Multilevel modeling and linear regression analyses of 642 children in Project HeartBeat!, aged 8-18 years (non-black and black), who had assessments of BMI, %BF, WC, sums of 2- and 6-skinfolds, and pubertal stage (PS) triennially between 1991 and 1995.
Results: In males, the normal pattern from PS1 to PS5 is for %BF to decrease, skinfold thickness to remain stable, and WC to increase. However, after adjusting for height, WC does not change. In females, %BF remains stable from PS1 to PS5, whereas skinfold thickness increases. As in males waist-height ratio does not change, indicating that central adiposity does not normally increase during puberty. Although BMI increases in both genders and races from PS1 to PS5, mean values at PS5 were well below 25 kg/m(2).
Conclusions: During puberty, increase in %BF is abnormal in females and even more so in males. Likewise, increase in waist-height ratio is also abnormal and may suggest an increased risk for adiposity-associated morbidity.
Copyright © 2010 Society for Adolescent Health and Medicine. All rights reserved.
Figures
Comment in
-
Dynamic changes of adiposity during puberty: life may not be linear.J Adolesc Health. 2010 Oct;47(4):322-3. doi: 10.1016/j.jadohealth.2010.06.023. J Adolesc Health. 2010. PMID: 20864000 Free PMC article. No abstract available.
References
-
- Yusuf S, Hawken S, Ounpuu S, et al. Effect of potentially modifiable risk factors associated with myocardial infarction in 52 countries (The INTERHEART Study): Case-control study. Lancet. 2004;364:937–952. - PubMed
-
- Division of Nutrition, Physical Activity and Obesity, National Center for Chronic Disease Prevention and Health Promotion. About BMI for Children and Teens. 2007
-
- Lemieux S, Prud’homme D, Bouchard C, et al. A single threshold value of waist girth identifies normal-weight and overweight subjects with excess visceral adipose tissue. Am J Clin Nutr. 1996;64:685–693. - PubMed
-
- Onat A, Avci GS, Barlan MM, et al. Measures of abdominal obesity assessed for visceral adiposity and relation to coronary risk. Int J Obes Relat Metab Disord. 2004;28:1018–1025. - PubMed
Publication types
MeSH terms
Grants and funding
LinkOut - more resources
Full Text Sources
Medical
Research Materials
Miscellaneous
