. 2010 Sep 24;39(6):912-924.
doi: 10.1016/j.molcel.2010.08.023.

HSP90 and its R2TP/Prefoldin-like cochaperone are involved in the cytoplasmic assembly of RNA polymerase II

Affiliations

HSP90 and its R2TP/Prefoldin-like cochaperone are involved in the cytoplasmic assembly of RNA polymerase II

Séverine Boulon et al. Mol Cell. .

Abstract

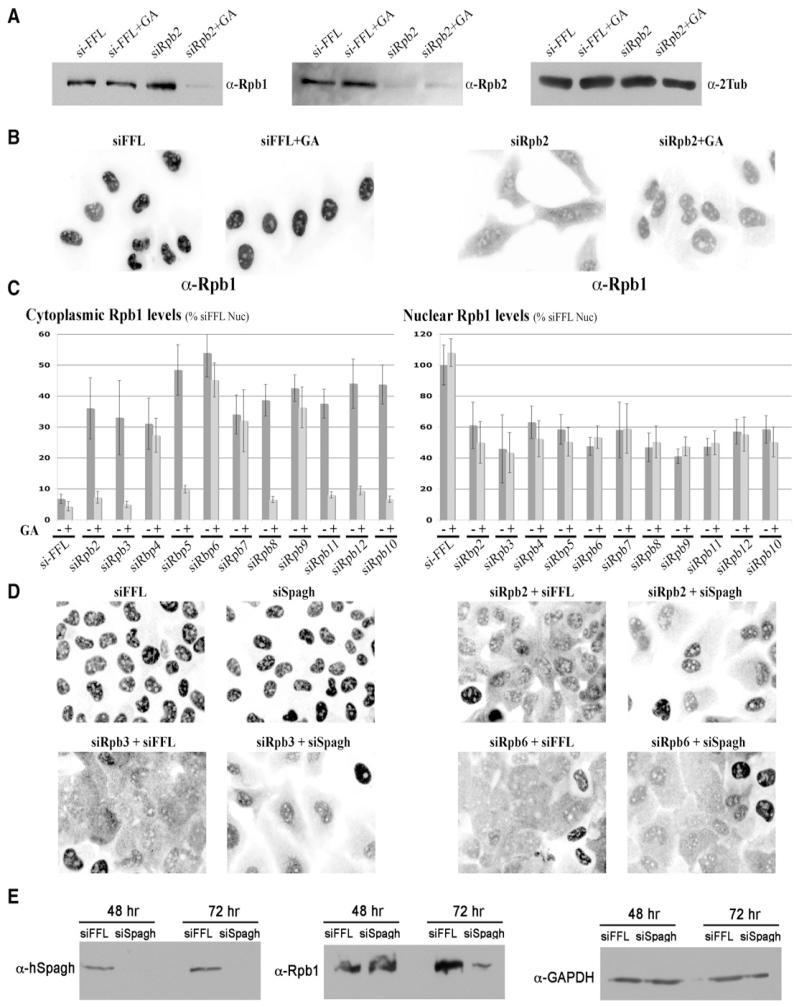
RNA polymerases are key multisubunit cellular enzymes. Microscopy studies indicated that RNA polymerase I assembles near its promoter. However, the mechanism by which RNA polymerase II is assembled from its 12 subunits remains unclear. We show here that RNA polymerase II subunits Rpb1 and Rpb3 accumulate in the cytoplasm when assembly is prevented and that nuclear import of Rpb1 requires the presence of all subunits. Using MS-based quantitative proteomics, we characterized assembly intermediates. These included a cytoplasmic complex containing subunits Rpb1 and Rpb8 associated with the HSP90 cochaperone hSpagh (RPAP3) and the R2TP/Prefoldin-like complex. Remarkably, HSP90 activity stabilized incompletely assembled Rpb1 in the cytoplasm. Our data indicate that RNA polymerase II is built in the cytoplasm and reveal quality-control mechanisms that link HSP90 to the nuclear import of fully assembled enzymes. hSpagh also bound the free RPA194 subunit of RNA polymerase I, suggesting a general role in assembling RNA polymerases.


Figures

Figure 1
Figure 1. Disruption of RNA Polymerase II Assembly Induces the Accumulation of Subunits Rpb1 and Rpb3 in the Cytoplasm
(A) Cytoplasmic accumulation of subunits Rpb1 and Rpb3 following treatment with LMB or α-amanitin. U2OS cells expressing a GFP-Rpb3 fusion were untreated (NT) or treated for 15 hr with α-amanitin (α-am, 10 μg/ml) and/or leptomycin B (LMB, 15 nM) and processed for immunofluorescence against Rpb1. Each field is 83.75 × 83.75 μm. DAPI stains nuclei. Similar results were obtained after 3 and 6 hr of treatments, although at these time points α-amanitin affects only a fraction of cells (not shown). (B) Depletion of subunit Rpb2 leads to the accumulation of newly synthesized Rpb1 in the cytoplasm. U2OS cells were transfected for 48 hr with siRNA against luciferase (siFFL) or Rpb2 (siRpb2) and treated or not with α-amanitin for 15 hr (10 μg/ml). Cells were processed for immunofluorescence against Rpb1. Each field is 83.75 × 117.25 μm. (C) Inhibition of RNA polymerase II transcription by DRB has no effect on the localization of Rpb1. U2OS cells were treated for 15 hr with DRB (100 μM), and the localization of Rpb1 was determined by immunofluorescence (panels α-Rpb1). FISH against polyA + RNAs was performed in parallel to assess the inhibition of transcription (panel PolyA+). Each field is 67 × 67 μm. (D) Depletion of RNA polymerase II subunits leads to the accumulation of Rpb1 in the cytoplasm. U2OS cells were transfected for 48 hr with siRNA against luciferase (siFFL) or the indicated subunit. Cells were processed for immunofluorescence with an antibody against Rpb1. Each field is 83.75 × 117.25 μm and contains few nondepleted cells that show wild-type nuclear Rpb1 levels.
Figure 2
Figure 2. GFP-Rpb1 and GFP-Rpb3 Associate with an HIV-1 Promoter with Similar Dynamics
(A) Schematic of the reporter construct used in the assay. The HIV-1 reporter plasmid was inserted in multiple tandem copies in the chromatin of U2OS cells. (B) Recovery of GFP-Rpb1 at the transcription site of the HIV-1 reporter. MS2-Cherry accumulates at the reporter transcription site (top left panel), together with GFP-Rpb1 (panel “prebleach”). Images of GFP-Rpb1 at the indicated time points show the regular and slow recovery of the protein at the transcription site. (C) Comparison of the recovery rate of GFP-Rpb3 and GFP-Rpb1 at the transcription site of the HIV-1 reporter gene. The recovery curves show very similar profiles for the two proteins. Time is in seconds.
Figure 3
Figure 3. Characterization of Partially Assembled RNA Polymerase II Subcomplexes by Quantitative SILAC Proteomic Analysis
(A) Comparison of GFP-Rpb3 complexes in the presence or absence of α-amanitin. Left panel: design of the triple-encoding SILAC GFP-Rpb3 pull-down experiment (see text). Right graph: SILAC results visualized on a 2D logarithmic graph for all proteins identified. SILAC ratios have been normalized so that IP contaminants are clustered at the origin of the graph. On the x axis, log2(M/L ratio) correlates with the enrichment in GFP-Rpb3 IP versus CTL IP. On the y axis, log2(H/M ratio) correlates with the enrichment in α-amanitin versus nontreated cells. The bait, Rpb3, is spotted in red, and a red line separates the proteins whose interaction with Rpb3 is increased after α-amanitin treatment (above the line) or decreased (below). Variations lower than 2-fold are not considered significant. Only proteins that are significantly enriched in GFP-Rpb3 IP (log[M/L] > 2) are labeled (spotted in orange), plus all R2TP/Prefoldin-like components (spotted in green) and all polymerase subunits (spotted in purple). Proteins that are identified or quantified with less than two peptides are labeled in gray and italic. SILAC ratio values of labeled proteins are listed in Table S1. (B) Model of changes in RNA polymerase II complex and associated factors in untreated cells versus α-amanitin-treated cells, according to SILAC results. The bait is circled in red and the color code is similar to the graph, except that RNA polymerase II subunits that show a decreased association with GFP-Rpb3 upon α-amanitin treatment are displayed in white. Gray lines represent two-hybrid interactions.
Figure 4
Figure 4. Unassembled Rpb1 Is Associated with the R2TP/Prefoldin-like Complex
(A) Comparison of Rpb1 complexes when RNA polymerase II assembly is normal or inhibited by α-amanitin and LMB. The experimental design is indicated on the left. It is similar to Figure 2, except that cells are treated simultaneously with α-amanitin and LMB (for 15 hr) and that an antibody against endogenous Rpb1 is used. Legend as in Figure 2. (B) Transcriptional shutdown does not result in polymerase disassembly (legend as in A). The experimental design is indicated on the left. Legend is as in Figure 2, except that cells were untreated or treated with α-amanitin + LMB (15 hr) or with actinomycin D (7 hr). (C) Unassembled Rpb1 is specifically associated with the R2TP/Prefoldin-like complex. SILAC ratios are from the experiment depicted in (B) and correspond to cells treated with α-amanitin + LMB versus those treated with actinomycin D. The ratios are normalized to that of Rpb1. (D) Model of the complex containing unassembled Rpb1 (legend as in Figure 3).
Figure 5
Figure 5. hSpagh Preferentially Associates with Unassembled Forms of the Large Subunits of RNA Polymerases I and II
(A and B) hSpagh preferentially binds incompletely assembled subunit Rpb1. U2OS cells stably expressing GFP-hSpagh were subjected to GFP-TRAP immunoprecipitation. Inputs and pellets were analyzed by western blots with the indicated antibodies. Cells were untreated (NT) or treated with α-amanitin and LMB (α-am LMB) (A). Cells were treated with siRNA against Rpb2 (GFP-hSpagh si-Rpb2) or luciferase as control (GFP-hSpagh) (B). The input lanes were loaded with one-tenth of the amount used for the immunoprecipitation. (C) hSpagh associates with unassembled RNA polymerase I subunit RPA194. Cells were treated with siRNA against RPA135 (GFP-hSpagh siRPA135) or luciferase (GFP-hSpagh), subjected to GFP-TRAP purification, and analyzed by western blotting with the indicated antibody. The input lanes were loaded with one-tenth the amount of extracts used in the purification. (D) Quantitative SILAC proteomic analyses of GFP-hSpagh complexes in cells treated or not with α-amanitin. Left panel shows the experimental design. U2OS cells stably expressing GFP-hSpagh were treated or not with α-amanitin and subjected to SILAC proteomic analysis. Right panel shows SILAC results visualized on a 2D logarithmic graph. x axis: log(M/L ratio) correlates with the enrichment of proteins in GFP-hSpagh IP versus control IP (untreated cells). y axis: log(H/M ratio) correlates with the enrichment of proteins in GFP-hSpagh IP in treated versus untreated cells. (E) Diagram displaying GFP-hSpagh complexes according to SILAC results. Legend is as in Figure 2, except that the thick bars represent direct physical interactions previously demonstrated (Boulon et al., 2008).
Figure 6
Figure 6. hSpagh Interacts with HSP90 and Unassembled Subunit Rpb1 in the Cytoplasm
(A) hSpagh interacts with HSP90 in the nucleus and the cytoplasm. U2OS cells were transfected with the indicated constructs and processed for epifluorescence microscopy. The p54 and Laci constructs were also fused to a red fluorescent protein. Each field is 38 × 38 μm. Insets: zoom on the boxed area (4.3 × 4.3 μm). (B) hSpagh interacts with subunit Rpb1 in the cytoplasm. U2OS cells were transfected with the indicated construct and siRNAs and then processed for immunofluorescence against Rpb1. Legend is as in (A). (C) hSpagh fails to recruit Rpb1 subunit at LacO array in the nucleoplasm. Legend is as in (A) and (B).
Figure 7
Figure 7. hSpagh and HSP90 Activity Stabilize Unassembled Cytoplasmic Rpb1 Subunit
(A) Inhibition of HSP90 activity with GA selectively destabilizes the unassembled Rpb1 subunit. U2OS cells were treated for 43 hr with control siRNAs (siFFL) or with siRNA against Rpb2 (siRpb2) and incubated with GA in the last 15 hr (GA, 2 μM) when indicated. Extracts were prepared in HNTG and analyzed by western blotting with antibodies against Rpb1, Rpb2, and tubulin. (B) Inhibition of HSP90 activity with GA selectively destabilizes cytoplasmic Rpb1 subunit. U2OS cells were treated as above and subjected to immunofluorescence against Rpb1. Each field is 83.75 × 117.25 μm. (C) All stages of polymerase II assembly are not equally sensitive to GA. The amount of subunit Rpb1 in the cytoplasm and nucleus was quantified as follows. Subunit Rpb1 was labeled by immunofluorescence, and images of cells treated as in (B) were taken with identical microscopic settings. Background was removed, and Rpb1 signals in the nucleus and cytoplasm were normalized to the nuclear signal of Rpb1 in untreated cells. Numbers are averages of more than 80 cells; bars are the standard deviations. (D) hSpagh stabilizes unassembled cytoplasmic Rpb1. U2OS cells were treated with the indicated siRNA for 43 hr and processed for immunofluorescence against Rpb1. Each field is 83.75 × 117.25 μm. (E) Destabilization of Rbp1 after long-term depletion of hSpagh. U2OS cells were treated with siRNAs against hSpagh for 48 or 72 hr and analyzed by western blotting with the indicated antibodies.

References

    1. Armache KJ, Kettenberger H, Cramer P. Architecture of initiation-competent 12-subunit RNA polymerase II. Proc. Natl. Acad. Sci. USA. 2003;100:6964–6968. - PMC - PubMed
    1. Boireau S, Maiuri P, Basyuk E, de la Mata M, Knezevich A, Pradet-Balade B, Bäcker V, Kornblihtt A, Marcello A, Bertrand E. The transcriptional cycle of HIV-1 in real-time and live cells. J. Cell Biol. 2007;179:291–304. - PMC - PubMed
    1. Boisvert FM, van Koningsbruggen S, Navascués J, Lamond AI. The multifunctional nucleolus. Nat. Rev. Mol. Cell Biol. 2007;8:574–585. - PubMed
    1. Boulon S, Marmier-Gourrier N, Pradet-Balade B, Wurth L, Verheggen C, Jády BE, Rothé B, Pescia C, Robert MC, Kiss T, et al. The Hsp90 chaperone controls the biogenesis of L7Ae RNPs through conserved machinery. J. Cell Biol. 2008;180:579–595. - PMC - PubMed
    1. Bushnell DA, Kornberg RD. Complete, 12-subunit RNA polymerase II at 4.1-A resolution: implications for the initiation of transcription. Proc. Natl. Acad. Sci. USA. 2003;100:6969–6973. - PMC - PubMed

Publication types

MeSH terms

LinkOut - more resources