Comparative Study
. 2011 Jan;39(2):578-88.
doi: 10.1093/nar/gkq817. Epub 2010 Sep 22.

A comparison of RNA-Seq and high-density exon array for detecting differential gene expression between closely related species

Affiliations
Comparative Study

A comparison of RNA-Seq and high-density exon array for detecting differential gene expression between closely related species

Song Liu et al. Nucleic Acids Res. 2011 Jan.

Abstract

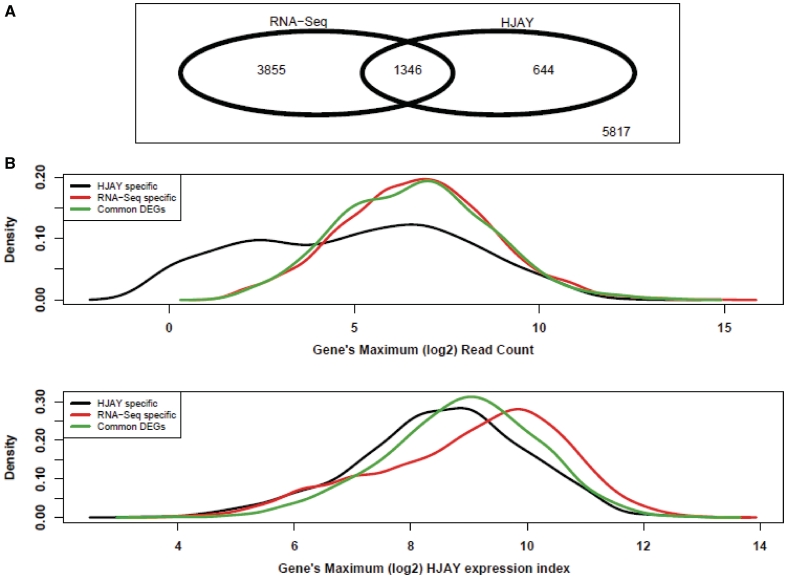
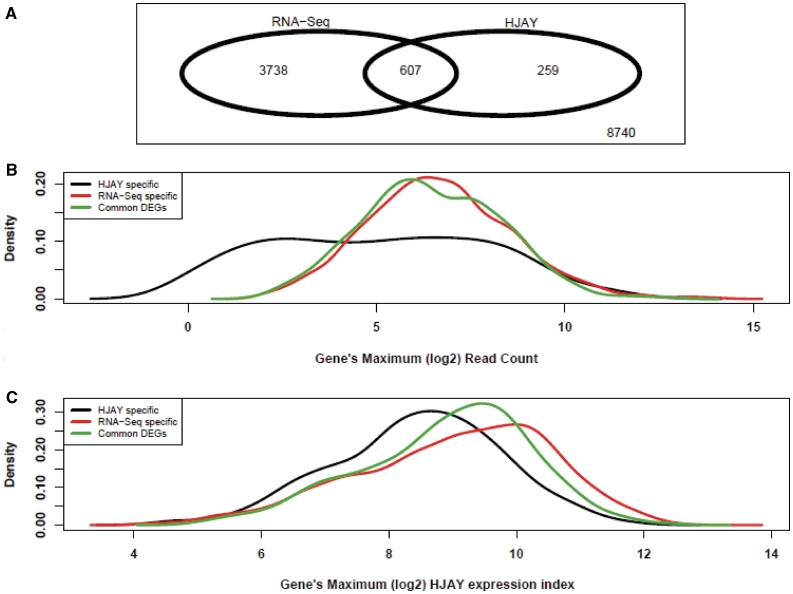
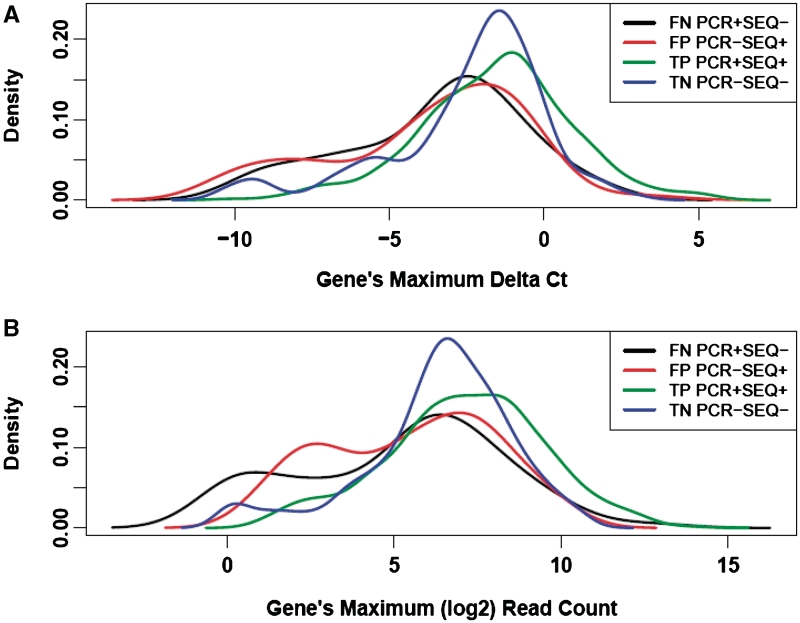
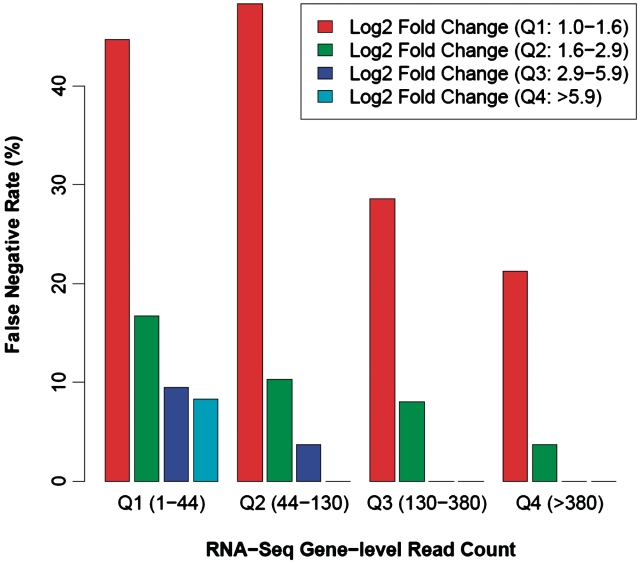
RNA-Seq has emerged as a revolutionary technology for transcriptome analysis. In this article, we report a systematic comparison of RNA-Seq and high-density exon array for detecting differential gene expression between closely related species. On a panel of human/chimpanzee/rhesus cerebellum RNA samples previously examined by the high-density human exon junction array (HJAY) and real-time qPCR, we generated 48.68 million RNA-Seq reads. Our results indicate that RNA-Seq has significantly improved gene coverage and increased sensitivity for differentially expressed genes compared with the high-density HJAY array. Meanwhile, we observed a systematic increase in the RNA-Seq error rate for lowly expressed genes. Specifically, between-species DEGs detected by array/qPCR but missed by RNA-Seq were characterized by relatively low expression levels, as indicated by lower RNA-Seq read counts, lower HJAY array expression indices and higher qPCR raw cycle threshold values. Furthermore, this issue was not unique to between-species comparisons of gene expression. In the RNA-Seq analysis of MicroArray Quality Control human reference RNA samples with extensive qPCR data, we also observed an increase in both the false-negative rate and the false-positive rate for lowly expressed genes. These findings have important implications for the design and data interpretation of RNA-Seq studies on gene expression differences between and within species.


Figures

Figure 1.
Figure 1.
A comparison of RNA-Seq and high-density HJAY array for detecting differential gene expression between human and rhesus cerebellum tissues. (A) The Venn diagram showing the overlap between differentially expressed genes (Human versus Rhesus Macaque, FDR <1% and FoldChange ≥2) detected by Illumina RNA-Seq and the Affymetrix HJAY array. Only genes that can be analyzed by both platforms are shown. (B and C) The density plot showing the distributions of gene-level RNA-Seq read counts and HJAY array expression indices for different sets of differentially expressed genes (DEGs) detected by the HJAY array only, or by RNA-Seq only, or by both (i.e. common DEGs). The x-axis is each gene’s maximum log2 RNA-Seq read count (B), or maximum HJAY log2 expression index (C) in human and rhesus samples.
Figure 2.
Figure 2.
A comparison of RNA-Seq and high-density HJAY array for detecting differential gene expression between human and chimpanzee cerebellum tissues. (A) The Venn diagram showing the overlap between differentially expressed genes (Human versus Chimpanzee, FDR <1% and FoldChange ≥2) detected by Illumina RNA-Seq and the Affymetrix HJAY array. Only genes that can be analyzed by both platforms are shown. (B and C) The density plot showing the distributions of gene-level RNA-Seq read counts and HJAY array expression indices for different sets of differentially expressed genes (DEGs) detected by the HJAY array only, or by RNA-Seq only, or by both (i.e. common DEGs). The x-axis is each gene’s maximum log2 RNA-Seq read count (B) or maximum HJAY log2 expression index (C) in human and chimpanzee samples.
Figure 3.
Figure 3.
The density plot showing the distribution of TaqMan qPCR delta Ct value (A) and gene-level RNA-Seq read counts (B) for different sets of genes: false negative set (black), false positive set (red), true positive set (green) and true negative set (blue) in the analysis of the MAQC reference RNA samples (UHR and brain). The x-axis is each gene’s maximum delta Ct value (POLR2A—gene of interest) (A), or maximum log2 RNA-Seq read count (B) in UHR and brain samples. The median TaqMan qPCR delta Ct of these four sets of gene is −2.83, −3.20, −1.41 and −1.77, respectively. The median RNA-Seq read count of these four sets of gene is 57, 59,145 and 98, respectively.
Figure 4.
Figure 4.
The ability of RNA-Seq to identify significant DEGs is positively associated with both the number of sequences per gene and the extent of expression change. Based on the TaqMan qPCR estimates of expression fold-change (FC) between the MAQC human UHR and brain samples, we grouped the 510 qPCR DEGs into four quartiles: first quartile, log2 FC between 1 and 1.6; second quartile, 1.6–2.9; third quartile, 2.9–5.9 and fourth quartile, >5.9. Similarly, we grouped the 510 qPCR DEGs into four quartiles based on the maximum gene-level RNA-Seq read count in the human UHR and brain samples: first quartile, read count 1–44; second quartile, 44–130; third quartile, 130–380 and fourth quartile, >380. For each fold-change group, we calculated the proportion of TaqMan qPCR DEGs missed by RNA-Seq (i.e. RNA-Seq false-negative rate) in individual RNA-Seq read count groups, as shown in the barchart.

References

    1. Khaitovich P, Enard W, Lachmann M, Paabo S. Evolution of primate gene expression. Nat. Rev. Genet. 2006;7:693–702. - PubMed
    1. Gilad Y, Borevitz J. Using DNA microarrays to study natural variation. Curr. Opin. Genet. Dev. 2006;16:553–558. - PubMed
    1. Preuss TM, Caceres M, Oldham MC, Geschwind DH. Human brain evolution: insights from microarrays. Nat. Rev. Genet. 2004;5:850–860. - PubMed
    1. Caceres M, Lachuer J, Zapala MA, Redmond JC, Kudo L, Geschwind DH, Lockhart DJ, Preuss TM, Barlow C. Elevated gene expression levels distinguish human from non-human primate brains. Proc. Natl Acad. Sci. USA. 2003;100:13030–13035. - PMC - PubMed
    1. Enard W, Khaitovich P, Klose J, Zollner S, Heissig F, Giavalisco P, Nieselt-Struwe K, Muchmore E, Varki A, Ravid R, et al. Intra- and interspecific variation in primate gene expression patterns. Science. 2002;296:340–343. - PubMed

Publication types