. 2010 Nov;12(6):771-9.
doi: 10.2353/jmoldx.2010.090169. Epub 2010 Sep 23.

A diagnostic assay based on microRNA expression accurately identifies malignant pleural mesothelioma

Affiliations

A diagnostic assay based on microRNA expression accurately identifies malignant pleural mesothelioma

Hila Benjamin et al. J Mol Diagn. 2010 Nov.

Abstract

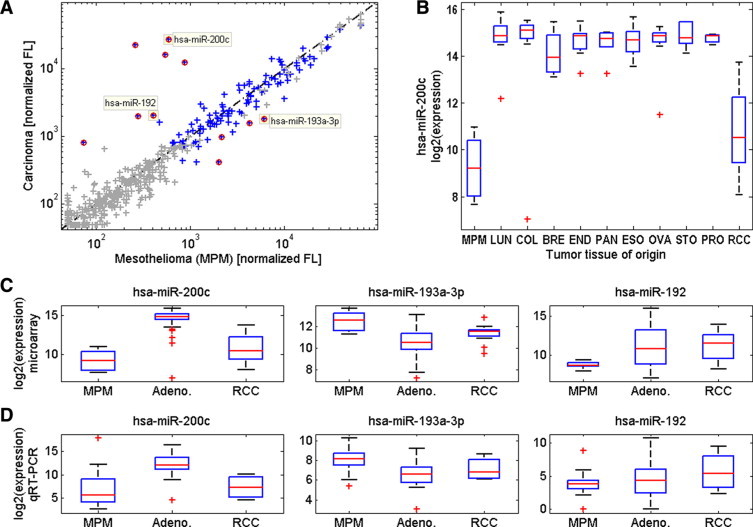
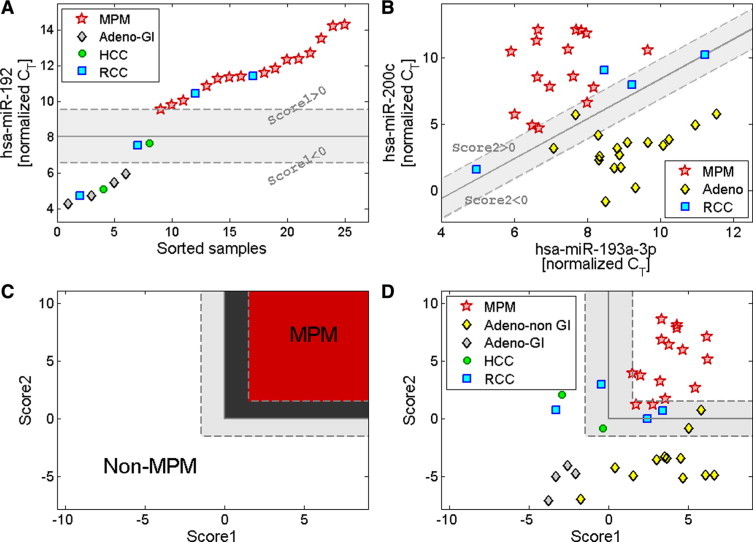
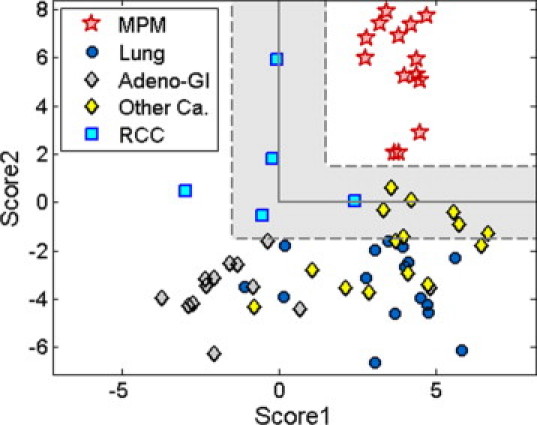
The definitive identification of malignant pleural mesothelioma (MPM) has significant clinical implications, yet other malignancies often involve the lung pleura, confounding the diagnosis of MPM. In the absence of accurate markers, MPM can be difficult to distinguish from peripheral lung adenocarcinoma and metastatic epithelial cancers. MicroRNA expression is tissue-specific and highly informative for identifying tumor origin. We identified microRNA biomarkers for the differential diagnosis of MPM and developed a standardized microRNA-based assay. Formalin-fixed, paraffin-embedded samples of 33 MPM and 210 carcinomas were used for assay development. Using microarrays, we identified microRNAs differentially expressed between MPM and various carcinomas. Hsa-miR-193-3p was overexpressed in MPM, while hsa-miR-200c and hsa-miR-192 were overexpressed in peripheral lung adenocarcinoma and carcinomas that frequently metastasize to lung pleura. We developed a standardized diagnostic assay based on the expression of these microRNAs. The assay reached a sensitivity of 100% and a specificity of 94% in a blinded validation set of 68 samples from the lung and pleura. This diagnostic assay can provide a useful tool in the differential diagnosis of MPM from other malignancies in the pleura.


Figures

Figure 1
Figure 1
Comparison of microRNA expression levels in MPM and carcinoma samples in the discovery phase. A: Median normalized fluorescence values (microarrays) of microRNAs in seven MPM samples are plotted against the median fluorescence values (microarrays) of these microRNAs in 97 carcinoma samples (Table 1). Gray crosses show control probes and microRNAs whose expression level was at background levels, and red circles mark microRNAs that had statistically significant differences in expression values after false discovery rate correction with at least a twofold change in median expression (see Materials and Methods). Yellow squares highlight the median expression levels of hsa-miR-200c, hsa-miR-192, and hsa-miR-193a–3p. B: Box plot of the expression levels of hsa-miR-200c in tumors of different tissue origin. Tumor origins include MPM (n = 7), RCC (n = 16), and 81 adenocarcinomas from: lung (LUN, n = 15), colon (COL, n = 17), breast (BRE, n = 4), endometrium (END, n = 9), pancreas (PAN, n = 6), esophagus (ESO, n = 11), ovary (OVA, n = 10), stomach (STO, n = 6), and prostate (PRO, n = 3). Units show log2 of the normalized fluorescence signal by microarray. C: Box-plots of the expression levels of hsa-miR-200c, hsa-miR-193a–3p, and hsa-miR-192, in these MPM, adenocarcinoma (Adeno.), and RCC samples. Units show log2 of the normalized fluorescence signal by microarray. D: Box plots of the expression levels of these microRNAs in 22 MPM samples, 39 adenocarcinoma samples, and four RCC samples, measured by qRT-PCR (Table 1). Units show the inverted normalized CT (see Materials and Methods). For all box plots, red crosses indicate outlier values that are defined as being over 1.5 times the distance between the 25th and 75th percentiles above the 75th percentile or below the 25th percentile.
Figure 2
Figure 2
The chosen microRNA combinations for differentiation of MPM from confounding cancers on the full training set. A: Expression level (normalized CT, see Materials and Methods) of hsa-miR-192 was measured using qRT-PCR for 32 MPM samples (red stars), 10 hepatocellular carcinoma samples (green circles), 18 RCC samples (blue squares), and 17 adenocarcinomas from the gastrointestinal tract (Adeno-GI; black-gray diamonds). The solid vertical line is a guide to the eye, demonstrating the effectiveness of hsa-miR-192 expression in separating MPM from hepatocellular carcinoma and carcinomas from the GI tract. Two of the MPM samples had much lower expression of hsa-miR-192 (undetected at 40 cycles) and were omitted from the figure for optimal scaling. B: Expression levels of hsa-miR-200c and hsa-miR-193a–3p were measured using qRT-PCR for 32 MPM samples (red stars), 18 RCC samples (blue squares), and 85 adenocarcinoma samples (Adeno; black-yellow diamonds). The solid diagonal line is a guide to the eye, demonstrating the effectiveness of the combined expression levels of hsa-miR-200c and hsa-miR-193a–3p in separating MPM from adenocarcinomas. Five of the adenocarcinoma samples had low expression of hsa-miR-193a–3p (normalized CT between 16.4 and 20.7, with normalized CT of hsa-miR-200c between −0.5 and 2.5) and were omitted from the figure for optimal scaling.
Figure 3
Figure 3
The classification rule for the differential diagnosis of MPM from confounding cancer types. Expression levels (normalized CT, see Materials and Methods) of hsa-miR-192, hsa-miR-193a–3p and hsa-miR-200c were measured using qRT-PCR for 39 samples from the training set selected for threshold delineation (Table 1) including MPM (red stars), hepatocellular carcinoma (green circles), RCC (blue squares), and adenocarcinomas (Adeno; black-yellow diamonds) including those from the gastrointestinal tract (Adeno-GI; black-gray diamonds). A: Threshold delineation for levels of hsa-miR-192. “Score1” was defined as Score1 = (hsa-miR-192 normalized CT) – 8.05. The solid vertical line indicates the cutoff on Score1 at Score1 = 0. The dotted lines and the shaded area mark a region near the cutoff value, with absolute value of Score1 less than 1.5. MPM samples have Score1 greater than 0. One additional MPM sample had much lower expression of hsa-miR-192 (undetected at 40 cycles) and a higher value of Score1, and was omitted from the figure for optimal scaling. B: Threshold delineation for the combined levels of hsa-miR-193a–3p and hsa-miR-200c. “Score2” was defined as Score2 = (hsa-miR-200c normalized CT) – 1.5 * (hsa-miR-193a–3p normalized CT) + 6.6. The solid diagonal line indicates the cutoff on Score2, at Score2 = 0. The dotted lines and the shaded area mark a region near the cutoff value, with absolute value of Score2 less than 1.5. MPM samples have Score2 greater than 0. C: A schematic of the classification rule designed for combining Score1 and Score2 using the training set. Samples are classified as MPM if both Score1 and Score2 are greater than 0 (upper-right region, shaded in red/dark gray), otherwise they are classified as non-MPM. The classification cutoff is marked by an L-shaped solid line. Score values near the cutoff are indicated by dotted lines and dark/light gray shade. D: Data for the samples used for threshold delineation presented on the axes of Score1 and Score2. Two samples, one MPM and one adenocarcinoma, had higher values of Score1, and were omitted from the figure for optimal scaling.
Figure 4
Figure 4
Validation of a microRNA-based qRT-PCR assay for the differential diagnosis of MPM from confounding cancer types. Expression levels (normalized CT, see Materials and Methods) of hsa-miR-192, hsa-miR-193a–3p, and hsa-miR-200c were measured using qRT-PCR for a validation set of 63 samples (Table 1) including MPM (red stars), lung adenocarcinoma (Lung; black-blue circles), adenocarcinomas from the gastrointestinal tract (Adeno-GI; black-gray diamonds), RCC (blue squares), and other carcinomas (Other Ca; black-yellow diamonds). All (14 of 14) MPM samples and 46 of 49 non-MPM samples were classified correctly. Samples with Score values outside of the shaded region (ie, not near the cutoff) were all correctly classified.

References

    1. Zervos MD, Bizekis C, Pass HI. Malignant mesothelioma 2008. Curr Opin Pulm Med. 2008;14:303–309. - PubMed
    1. Ismail-Khan R, Robinson LA, Williams CC, Jr, Garrett CR, Bepler G, Simon GR. Malignant pleural mesothelioma: a comprehensive review. Cancer Control. 2006;13:255–263. - PubMed
    1. Yarborough CM. Chrysotile as a cause of mesothelioma: an assessment based on epidemiology. Crit Rev Toxicol. 2006;36:165–187. - PubMed
    1. Yang H, Testa JR, Carbone M. Mesothelioma epidemiology, carcinogenesis, and pathogenesis. Curr Treat Options Oncol. 2008;9:147–157. - PMC - PubMed
    1. Suzuki Y. Pathology of human malignant mesothelioma–preliminary analysis of 1,517 mesothelioma cases. Ind Health. 2001;39:183–185. - PubMed

Publication types

MeSH terms