

Obstetrical intervention and the singleton preterm birth rate in the United States from 1991-2006
- PMID: 20864720
- PMCID: PMC2951941
- DOI: 10.2105/AJPH.2009.180570
Obstetrical intervention and the singleton preterm birth rate in the United States from 1991-2006
Abstract
Objectives: We examined the relationship between obstetrical intervention and preterm birth in the United States between 1991 and 2006.
Methods: We assessed changes in preterm birth, cesarean delivery, labor induction, and associated risks. Logistic regression modeled the odds of preterm obstetrical intervention after risk adjustment.
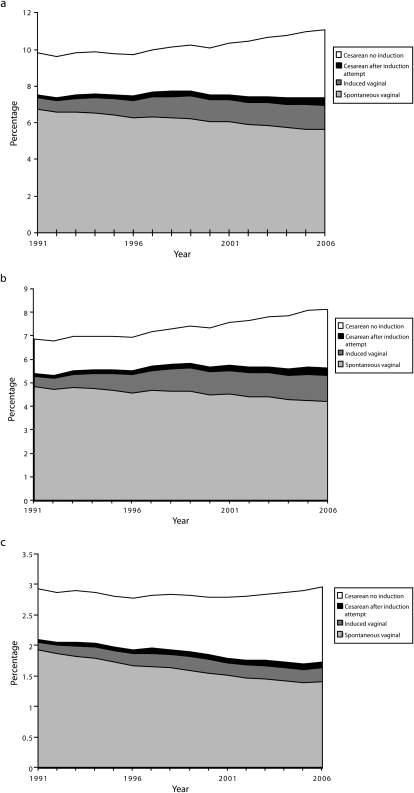
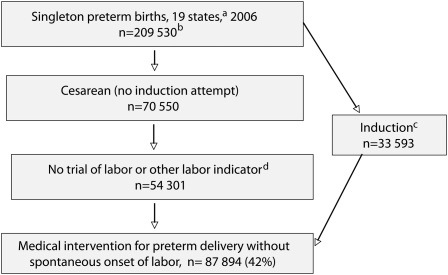
Results: From 1991 to 2006, the percentage of singleton preterm births increased 13%. The cesarean delivery rate for singleton preterm births increased 47%, and the rate of induced labor doubled. In 2006, 51% of singleton preterm births were spontaneous vaginal deliveries, compared with 69% in 1991. After adjustment for demographic and medical risks, the mother of a preterm infant was 88% (95% confidence interval [CI] = 1.87, 1.90) more likely to have an obstetrical intervention in 2006 than in 1991. Using new birth certificate data from 19 states, we estimated that 42% of singleton preterm infants were delivered via induction or cesarean birth without spontaneous onset of labor.
Conclusions: Obstetrical interventions were related to the increase in the US preterm birth rate between 1991 and 2006. The public health community can play a central role in reducing medically unnecessary interventions.
Figures
References
-
- Martin JA, Hamilton BE, Sutton PD, et al. Births: final data for 2006. Natl Vital Stat Rep. January 7, 2009;57(7).
-
- National Center for Health Statistics Advance report of maternal and infant health data from the birth certificate, 1991. Month Vital Stat Rep. May 11, 1994;42(suppl 11).
-
- Menacker F. Trends in cesarean rates for first births and repeat cesarean rates for low-risk women: United States, 1990–2003. Natl Vital Stat Rep. September 22, 2005;54(4). - PubMed
-
- Bailit JL, Love TE, Mercer B. Rising cesarean rates: are patients sicker? Am J Obstet Gynecol. 2004;191(3):800–803 - PubMed
MeSH terms
LinkOut - more resources
Full Text Sources
Medical
