

Modeling and dynamics of the inward-facing state of a Na+/Cl- dependent neurotransmitter transporter homologue
- PMID: 20865057
- PMCID: PMC2928745
- DOI: 10.1371/journal.pcbi.1000905
Modeling and dynamics of the inward-facing state of a Na+/Cl- dependent neurotransmitter transporter homologue
Abstract
The leucine transporter (LeuT) has recently commanded exceptional attention due mainly to two distinctions; it provides the only crystal structures available for a protein homologous to the pharmacologically relevant neurotransmitter: sodium symporters (NSS), and, it exhibits a hallmark 5-TM inverted repeat ("LeuT-fold"), a fold recently discovered to also exist in several secondary transporter families, underscoring its general role in transporter function. Constructing the transport cycle of "LeuT-fold" transporters requires detailed structural and dynamic descriptions of the outward-facing (OF) and inward-facing (IF) states, as well as the intermediate states. To this end, we have modeled the structurally unknown IF state of LeuT, based on the known crystal structures of the OF state of LeuT and the IF state of vSGLT, a "LeuT-fold" transporter. The detailed methodology developed for the study combines structure-based alignment, threading, targeted MD and equilibrium MD, and can be applied to other proteins. The resulting IF-state models maintain the secondary structural features of LeuT. Water penetration and solvent accessibility calculations show that TM1, TM3, TM6 and TM8 line the substrate binding/unbinding pathway with TM10 and its pseudosymmetric partner, TM5, participating in the extracellular and intracellular halves of the lumen, respectively. We report conformational hotspots where notable changes in interactions occur between the IF and OF states. We observe Na2 exiting the LeuT-substrate- complex in the IF state, mainly due to TM1 bending. Inducing a transition in only one of the two pseudosymmetric domains, while allowing the second to respond dynamically, is found to be sufficient to induce the formation of the IF state. We also propose that TM2 and TM7 may be facilitators of TM1 and TM6 motion. Thus, this study not only presents a novel modeling methodology applied to obtain the IF state of LeuT, but also describes structural elements involved in a possibly general transport mechanism in transporters adopting the "LeuT-fold".
Conflict of interest statement
The authors have declared that no competing interests exist.
Figures

 ions are in yellow, and the substrate, leucine, is colored by element name (H: white, C: gray, N: blue, O: red). TM10 is transparent for clarity. Center: A 180
 -rotated view of the structure is shown. TM5 is transparent for clarity. Right: The outer scaffolding helices, TM4, TM5, TM9, and TM10, are shown separated (above) from TM1, TM2, TM3, TM6, TM7, and TM8 (below) for clarity.


 positions from the crystal structure (red, blue) and from the starting (
 ns) structure (orange, cyan) during the 50 ns TMD+20 ns equilibration in monomer A (red, orange), compared to those in 70 ns free MD of monomer B (blue, cyan). The starting structure (
 ns) of these simulations corresponds to a structure obtained after 10 ns of equilibration performed previously (see Methods). For both
  (left) and
  (right), the structures relax to a conformation distinctly different from the reference OF-occ structures.

 and
and  . In the center, EC (top) and IC (bottom) views of TM1-TM10 are shown with superimposed snapshots, taken before (transparent) and after (solid) the
  simulation. TM3 and TM8 C
 atoms were used for the superposition. Pseudosymmetric pairs of helices are colored the same, with darker colors for TM1-TM5, and lighter for TM6-TM10 i.e. TM1 and TM6 are red, TM2 and TM7 are blue, TM3 and TM8 are golden, TM4 and TM9 are violet, and, TM5 and TM10 are green. Closing of TM1, TM7, and TM10 in the EC half and opening of TM6, TM2, and TM5 in the IC half are clearly visible, corresponding to the differential contact maps. B. Side views of the less mobile TM3-TM4-TM5-TM8-TM9-TM10 scaffold (left) and the highly mobile TM1-TM2-TM6-TM7 bundle (right) are shown separately, in superimposed snapshots taken before (transparent) and after (solid) the
  simulation. The coloring scheme is as above. The position of the substrate (gray) and
  ions (yellow) before (transparent) and after (solid) the simulation are also shown. Dotted black lines highlight the motion in the helices.
 simulation. The coloring scheme is as in Fig. 6. Variation of distance between salt bridging residues in the EC (top) and IC (bottom) half-lumens for
  (left) and
  (right) are shown. The distances are compared between monomer A, which undergoes TMD and monomer B, which undergoes free MD and serves as a control system.
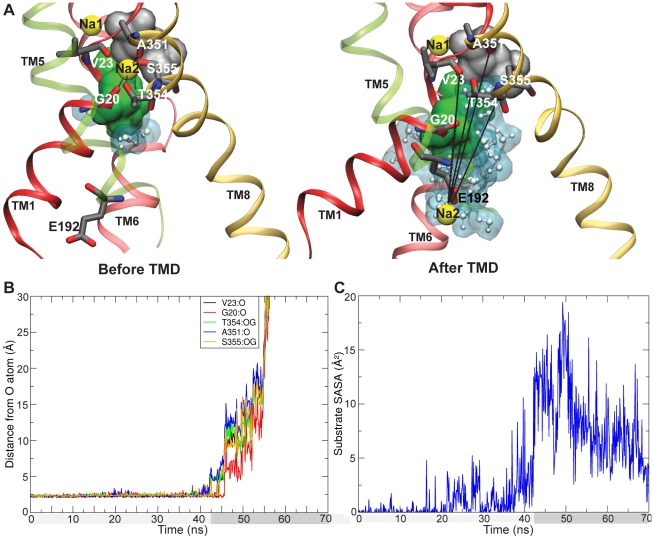
 is shown, with the Na2 binding residues marked. E192, which binds Na2 (yellow) along its unbinding and release from the binding site is also shown. The substrate (Leu) is shown in gray. N21 and S256, which protect the substrate from water within a cavity below the substrate, are shown as a green surface. TM1 (red) and TM8 (golden), which bind Na2, TM6 (light red) which carries S256, and TM5 (green, transparent), which carries E192 are shown. Other parts of the protein are hidden for clarity. Water is shown as white molecules with a blue surface. B. The distance of Na2 from O atoms of binding residues is shown for the
  simulation. Na2 release occurs around
  ns. C. SASA of the substrate is shown for the
  simulation. The substrate SASA increases around the same time as Na2 release occurs, due to water access through the empty Na2 site.
Similar articles
-
Monitoring conformational changes in the human neurotransmitter transporter homologue LeuT with 19F-NMR spectroscopy.J Neurochem. 2025 Jan;169(1):e16278. doi: 10.1111/jnc.16278. J Neurochem. 2025. PMID: 39680492 Free PMC article.
-
Substrate-modulated gating dynamics in a Na+-coupled neurotransmitter transporter homologue.Nature. 2011 Jun 2;474(7349):109-13. doi: 10.1038/nature09971. Epub 2011 Apr 24. Nature. 2011. PMID: 21516104 Free PMC article.
-
Crystal structures of LeuT reveal conformational dynamics in the outward-facing states.J Biol Chem. 2021 Jan-Jun;296:100609. doi: 10.1016/j.jbc.2021.100609. Epub 2021 Apr 1. J Biol Chem. 2021. PMID: 33811858 Free PMC article.
-
The use of LeuT as a model in elucidating binding sites for substrates and inhibitors in neurotransmitter transporters.Biochim Biophys Acta. 2015 Mar;1850(3):500-10. doi: 10.1016/j.bbagen.2014.04.011. Epub 2014 Apr 24. Biochim Biophys Acta. 2015. PMID: 24769398 Review.
-
Substrate and drug binding sites in LeuT.Curr Opin Struct Biol. 2010 Aug;20(4):415-22. doi: 10.1016/j.sbi.2010.05.007. Epub 2010 Jun 16. Curr Opin Struct Biol. 2010. PMID: 20739005 Free PMC article. Review.
Cited by
-
The substrate import mechanism of the human serotonin transporter.Biophys J. 2022 Mar 1;121(5):715-730. doi: 10.1016/j.bpj.2022.01.024. Epub 2022 Feb 1. Biophys J. 2022. PMID: 35114149 Free PMC article.
-
Transmembrane helix 6b links proton and metal release pathways and drives conformational change in an Nramp-family transition metal transporter.J Biol Chem. 2020 Jan 31;295(5):1212-1224. doi: 10.1074/jbc.RA119.011336. Epub 2019 Dec 27. J Biol Chem. 2020. PMID: 31882536 Free PMC article.
-
X-ray structures of LeuT in substrate-free outward-open and apo inward-open states.Nature. 2012 Jan 9;481(7382):469-74. doi: 10.1038/nature10737. Nature. 2012. PMID: 22230955 Free PMC article.
-
The Environment Shapes the Inner Vestibule of LeuT.PLoS Comput Biol. 2016 Nov 11;12(11):e1005197. doi: 10.1371/journal.pcbi.1005197. eCollection 2016 Nov. PLoS Comput Biol. 2016. PMID: 27835643 Free PMC article.
-
Proton Control of Transitions in an Amino Acid Transporter.Biophys J. 2019 Oct 1;117(7):1342-1351. doi: 10.1016/j.bpj.2019.07.056. Epub 2019 Aug 26. Biophys J. 2019. PMID: 31500802 Free PMC article.
References
-
- Nelson N. The family of Na+/Cl−- neurotransmitter transporters. J Neurochem. 1998;71:1785–1803. - PubMed
-
- Yamashita A, Singh SK, Kawate T, Jin Y, Gouaux E. Crystal structure of a bacterial homologue of Na+/Cl−-dependent neurotransmitter transporters. Nature. 2005;437:215–233. - PubMed
-
- Beuming T, Shi L, Javitch JA, Weinstein H. A comprehensive structure-based alignment of prokaryotic and eukaryotic neurotransmitter/Na+ symporters (NSS) aids in the use of the LeuT structure to probe NSS structure and function. Mol Pharmacol. 2006;70:1630–1642. - PubMed
-
- Chen NH, Reith ME, Quick MW. Synaptic uptake and beyond: the sodium- and chloride-dependent neurotransmitter transporter family SLC6. Pflugers Arch. 2004;447:519–531. - PubMed
-
- Gether U, Andersen PH, Larsson OM, Schousboe A. Neurotransmitter transporters: molecular function of important drug targets. Trends Pharmacol Sci. 2006;27:375–383. - PubMed
Publication types
MeSH terms
Substances
Grants and funding
LinkOut - more resources
Full Text Sources
Research Materials
Miscellaneous
