. 2010 Aug 26;6(8):e1000907.
doi: 10.1371/journal.pcbi.1000907.

Evolution under fluctuating environments explains observed robustness in metabolic networks

Affiliations

Evolution under fluctuating environments explains observed robustness in metabolic networks

Orkun S Soyer et al. PLoS Comput Biol. .

Abstract

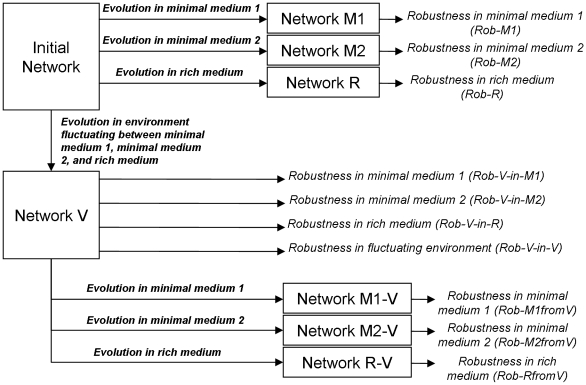
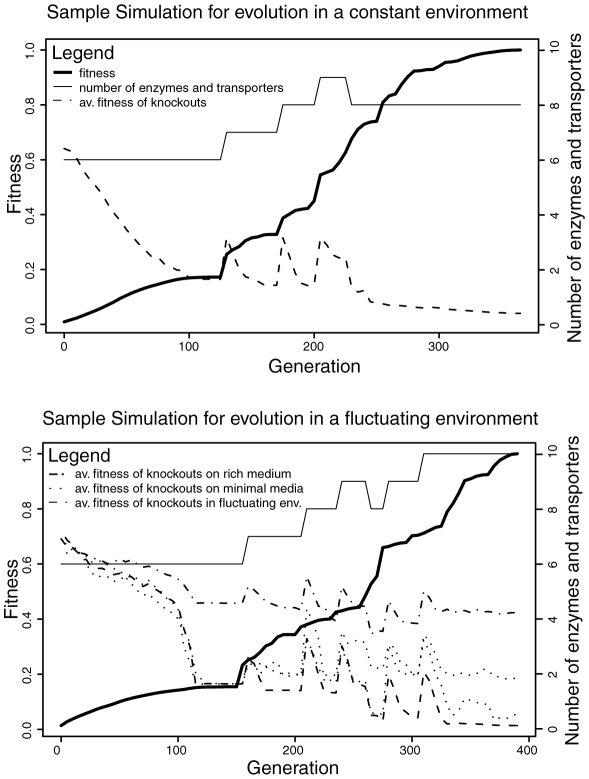
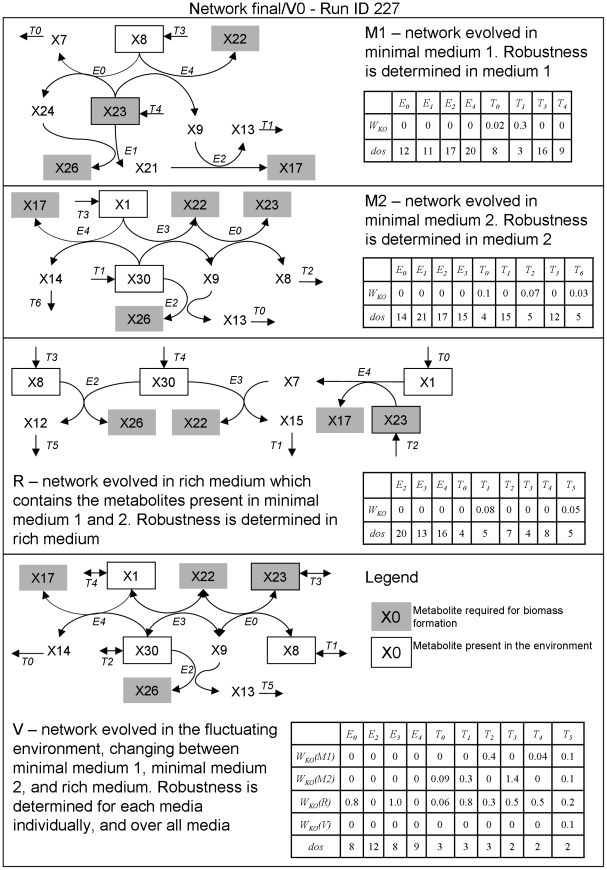
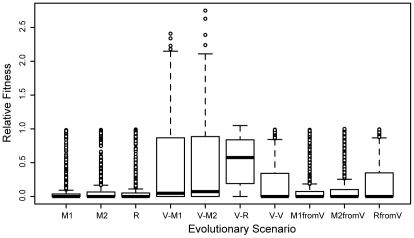
A high level of robustness against gene deletion is observed in many organisms. However, it is still not clear which biochemical features underline this robustness and how these are acquired during evolution. One hypothesis, specific to metabolic networks, is that robustness emerges as a byproduct of selection for biomass production in different environments. To test this hypothesis we performed evolutionary simulations of metabolic networks under stable and fluctuating environments. We find that networks evolved under the latter scenario can better tolerate single gene deletion in specific environments. Such robustness is underlined by an increased number of independent fluxes and multifunctional enzymes in the evolved networks. Observed robustness in networks evolved under fluctuating environments was "apparent," in the sense that it decreased significantly as we tested effects of gene deletions under all environments experienced during evolution. Furthermore, when we continued evolution of these networks under a stable environment, we found that any robustness they had acquired was completely lost. These findings provide evidence that evolution under fluctuating environments can account for the observed robustness in metabolic networks. Further, they suggest that organisms living under stable environments should display lower robustness in their metabolic networks, and that robustness should decrease upon switching to more stable environments.


Conflict of interest statement

The authors have declared that no competing interests exist.

Figures

Figure 1
Figure 1. Analysis scheme.
To investigate the evolution of robustness against knock-outs we simulate evolution of metabolic networks in different environmental scenarios and under selection for rate of biomass formation. We consider three constant environments containing either minimal medium 1, minimal medium 2 or rich medium, and a fluctuating one that switches between these three media. The resulting networks are referred to as network M1, M2, R, and V, respectively. The networks are tested for robustness by determining the fitness of knockouts. The three networks from the constant environments (M1, M2, R) are tested in the environment where they evolved. The network from the fluctuating environment (network V) is tested individually in each of the three media it adapted to during evolution, and over all three media. In summary, we have four different sets of evolved networks (M1, M2, R, V) and seven different distributions of fitness values of knockouts (Rob-M1, Rob-M2, Rob-R, Rob-V-M1, Rob-V-M2, Rob-V-R, Rob-V-V). To test whether differences in robustness between networks from constant and from fluctuating environments are transient, the network from the fluctuating environment is subsequently evolved in the three constant environments, and the emerging networks are tested for robustness. This gives three additional sets of evolved networks (VM1, VM2, VR), and three additional distributions characterizing their robustness (Rob-M1fromV, Rob-M2fromV, Rob-RfromV).
Figure 2
Figure 2. Results from sample M1 and V simulations.
The plot shows the number of unique transporters and enzymes, network fitness (relative to final fitness), and the average fitness of a knockout (i.e. robustness) over generations. Initially robustness is high because the ancestral network contains enzymes with broad specificity, which can compensate for each other. As enzymes specialize fitness increases and robustness decreases in general. Whenever an enzyme or transporter duplicates (as at generation 120, 170 and 190 for the M1 run), the robustness increases because the two copies initially cover the same reactions. As the copies diverge in function, their contribution to robustness becomes smaller and smaller. The simulation of evolution in the fluctuating environment (lower panel) shows that although robustness over all environments decreases over time, robustness is maintained to a considerable degree on each of the three media, in particular the rich one. The resulting networks from these simulations are shown in Figure 3.
Figure 3
Figure 3. Structure, reaction kinetics and knockout effects for sample networks resulting from evolution under three different stable environments (M1, M2, and R) and one that fluctuates over these three (V).
Metabolites constituting biomass are shown with a gray backdrop, while metabolites taken from the medium are shown in a black box. For example, network M1 takes up metabolites X8 and X23 (in binary notation, metabolites 01000 and 10111) from the media and uses a network of 4 enzymes and 4 transporters in order to produce biomass metabolites X17, X22, X23 and X26 (in binary notation, metabolites 10001, 10110, 10111, and 11010). The net reaction of the network is 2×01000+4×10111→biomass +00111+01101. The latter two metabolites are the waste products X7 and X13. Note that in this sample run, one of the metabolites required for biomass formation happens to be present in the environment. The table shows that most knockouts are lethal in this network. Only transporters T0 and T1, which excrete the waste products X7 and X13 respectively, can be knocked out. Even then, the knockout infers large fitness costs as without the transporters the waste metabolites accumulate in the cell and strongly inhibit growth. Network M2 uses X1 and X30 for biomass formation. The resulting network consists of 4 enzymes and 5 transporters. X8, X13 and X14 are excreted as waste products. The rich medium combines the resources available in the two minimal media.
Figure 4
Figure 4. Distribution of relative fitness for single knockouts in networks resulting from different evolutionary scenarios.
Each distribution contains measurements from 100 networks and is shown as a boxplot, as implemented in the statistical package “R” (www.r-project.org). See legend of Figure 1 for analysis and naming details. To statistically analyze differences between the distributions, we performed pair-wise Kolmogorov-Smirnov tests. As expected, differences between equivalent distributions were statistically not significant (M1 vs. M2: p≈0.6; M1fromV vs. M2fromV: p≈0.3; V-M1 vs. V-M2: p≈0.7). The fitness distribution for R networks is highly similar to M1 and M2 (p≈0.96 and 0.8, respectively). The distributions M1fromV and M2fromV are similar to the distributions M1, M2 and R, with indication for statistically significant differences: Four of the pair-wise comparisons yield p-values larger than 0.1; while two comparisons yield p-values below 0.05 (M2fromV vs. M1: p≈0.026; M2fromV vs. R p≈0.008). All other pair-wise comparisons show statistically highly significant differences, with all p-values smaller than 0.0001.

References

    1. Alonso JM, Stepanova AN, Leisse TJ, Kim CJ, Chen H, et al. Genome-wide insertional mutagenesis of Arabidopsis thaliana. Science. 2003;301:653–657. - PubMed
    1. Giaever G, Chu AM, Ni L, Connelly C, Riles L, et al. Functional profiling of the Saccharomyces cerevisiae genome. Nature. 2002;418:387–391. - PubMed
    1. Glass JI, Assad-Garcia N, Alperovich N, Yooseph S, Lewis MR, et al. Essential genes of a minimal bacterium. Proc Natl Acad Sci U S A. 2006;103:425–430. - PMC - PubMed
    1. Kamath RS, Fraser AG, Dong Y, Poulin G, Durbin R, et al. Systematic functional analysis of the Caenorhabditis elegans genome using RNAi. Nature. 2003;421:231–237. - PubMed
    1. Kobayashi K, Ehrlich SD, Albertini A, Amati G, Andersen KK, et al. Essential Bacillus subtilis genes. Proc Natl Acad Sci U S A. 2003;100:4678–4683. - PMC - PubMed

Publication types