. 2010 Aug 26;6(8):e1000918.
doi: 10.1371/journal.pcbi.1000918.

An introduction to biomolecular graphics

Affiliations

An introduction to biomolecular graphics

Cameron Mura et al. PLoS Comput Biol. .
No abstract available


Conflict of interest statement

One author (JV) is employed by Schrödinger LLC, distributor of the PyMOL software package.

Figures

Figure 1
Figure 1. The overall fold of a carbonic anhydrase.
The three domains of CsoS3 (PDB 2G13; [21]) are distinguished by separate coloring (blue, yellow, red). The orientation was chosen to feature the location of the active site (outlined by side chains and zinc ion), and to show the two-fold symmetry relationship between the active domain (yellow) and homologous but defunct domain (red). Structural elements are labeled directly on the individual SSEs. Domain labels are colored to correspond to the domains they are labeling. Labels in the active site are given an “outer glow” to make them legible in a region of the figure that is dense in detail. Depth is conveyed by use of fog, veiling less important structural features toward the back of the enzyme.
Figure 2
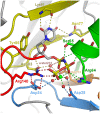
Figure 2. The active site of Mycobacterium tuberculosis dUTPase.
The orientation of the active site of this dUTPase (PDB 1SIX; [35]) was chosen to feature the geometry of the reaction it catalyzes, specifically the in-line nucleophilic attack of water 212 on the alpha-phosphate of dUTP. The orientation was fine-tuned to eliminate overlap of side chains and to make all hydrogen bonds (dashed lines) visible. Only side chains directly involved in catalysis are depicted. Carbons are colored according to five conserved motifs of the dUTPase family. Non-conserved residues are given a less-distracting gray color and are veiled in fog. Label colors match the side chains being labeled.
Figure 3
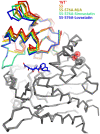
Figure 3. An overlay of five simvastatin synthetase crystal structures, illustrating varying degrees of hinge closure imparted by ligand binding.
Hinge motion in this two-domain enzyme (PDB 3HLB, 3HLC, 3HLE, 3HLF, and 3HLG) is highlighted by superimposing only atoms in one of the domains (colored grey in this figure). The range of motion is highlighted by the rainbow colors assigned to the upper domain. The orientation of the molecule is chosen to make the range of motion evident (hinge axis normal to the plane of the page). Each of the structures is labeled explicitly in the figure, rather than burying the information in the figure legend. Color coding the labels makes it easier to comprehend how each ligand affects the hinge motion. The structures are represented as Cα traces rather than cartoon ribbons because the motion is relatively small, and the Cα trace allows a more exact representation of the position of the atoms.
Figure 4
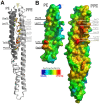
Figure 4. An intermolecular interface from the M. tuberculosis PE-PPE system (PDB 2G38).
The complex between PE and PPE is shown as a ribbon cartoon (A); the two proteins are colored separately to make the interface evident. Hydrophobic side chains involved in the interface are labeled. The complementary surfaces are illustrated more clearly in (B), by splitting the complex apart like a clamshell (triangular wedge in A). Labels identify the PE and PPE proteins. Hydrophobicity is indicated by grading of cool→warm colors, as shown. Both panels are labeled and depicted on the same scale, so readers can easily see how 3D residue positions at the interface (A) correspond to apolar surface patches in (B).
Figure 5
Figure 5. Best-fit planes.
This figure illustrates the results from computing and rendering the best-fit plane to a set of atoms. As described in the text, the plane was calculated via SVD on the phosphate atoms (orange spheres) of one leaflet of this POPC bilayer, and is rendered as a semi-transparent orange surface. The two leaflets are shown as wireframes, with a single lipid shown as CPK spheres; carbons are colored wheat in one leaflet and light grey in the other. The computed bilayer normal is drawn as an arrow, as are the two basis vectors which span the subspace defining the planar membrane.

References

    1. DeLano WL. The PyMOL Molecular Graphics System. 2008. http://pymol.org.
    1. Bottomley S, Helmerhorst E. Molecular Visualization. In: Gu J, Bourne PE, editors. Structural Bioinformatics. 2nd ed. Hoboken, NJ: John Wiley & Sons; 2009.
    1. Atwood JL, Barbour LJ. Molecular Graphics: From Science to Art. Crystal Growth & Design. 2003;3:3–8.
    1. Olson AJ. Molecular graphics and animation. In: Rossmann MG, Arnold E, Fuess H, Hahn T, Wondratschek H, et al., editors. International Tables for Crystallography. Chester, England: International Union of Crystallography; 2006.
    1. Goddard TD, Ferrin TE. Visualization software for molecular assemblies. Curr Opin Struct Biol. 2007;17:587–595. - PMC - PubMed

Publication types