. 2011 Jan;213(1):105-18.
doi: 10.1007/s00213-010-2017-2. Epub 2010 Sep 24.

Effects of cocaine rewards on neural representations of cognitive demand in nonhuman primates

Affiliations

Effects of cocaine rewards on neural representations of cognitive demand in nonhuman primates

Robert E Hampson et al. Psychopharmacology (Berl). 2011 Jan.

Abstract

Rationale: Investigations of the neural consequences of the effects of cocaine on cognition have centered on specific brain circuits including prefrontal cortex, medial temporal lobe and striatum and their roles in controlling drug dependent behavior and addiction. These regions are critical to many aspects of drug abuse; however recent investigations in addicted individuals have reported possible cognitive deficits that impact recovery and other therapeutic interventions.

Objectives: Therefore a direct assessment of the effects of cocaine as a reward for cognitive function provides a means of determining how brain systems involved such as prefrontal cortex are affected under normal vs. conditions of acute drug exposure as a precursor to the final impaired function in the addicted state.

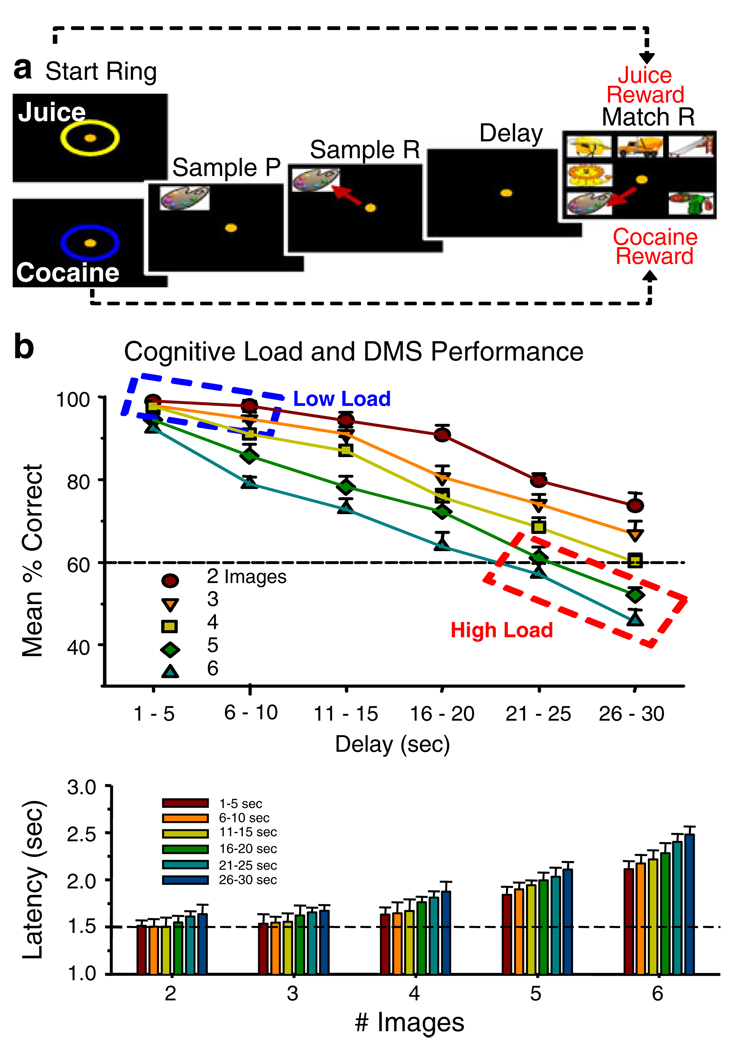
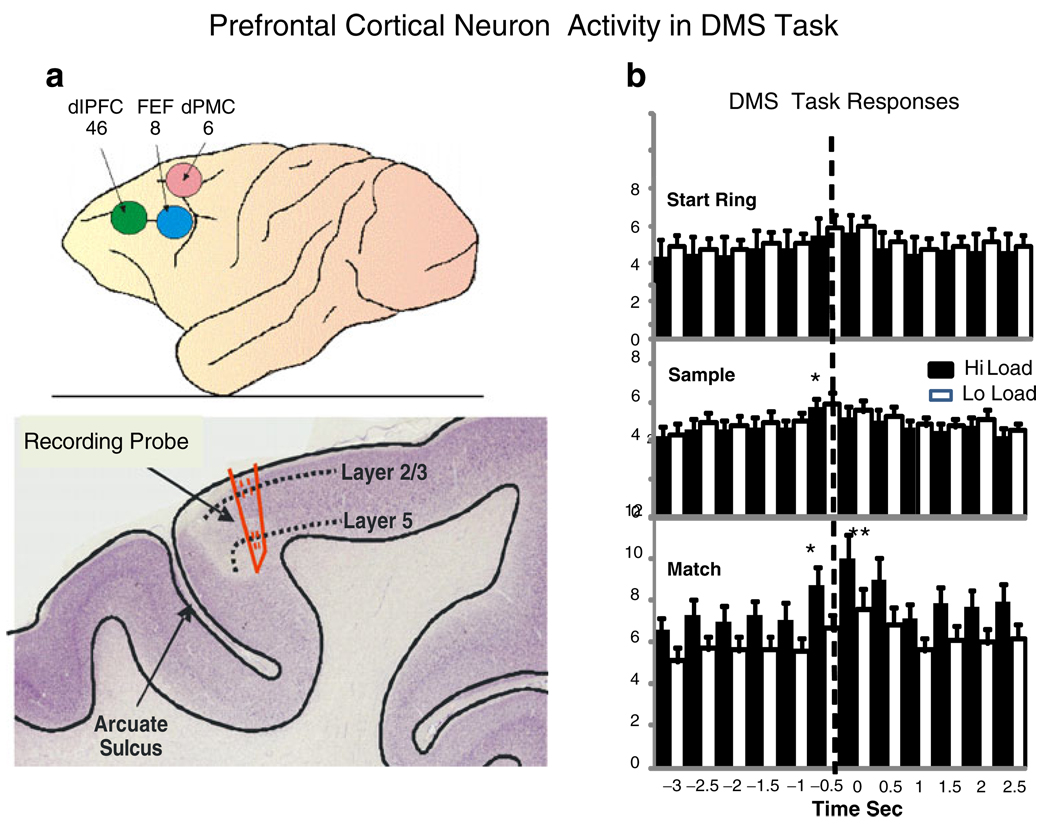
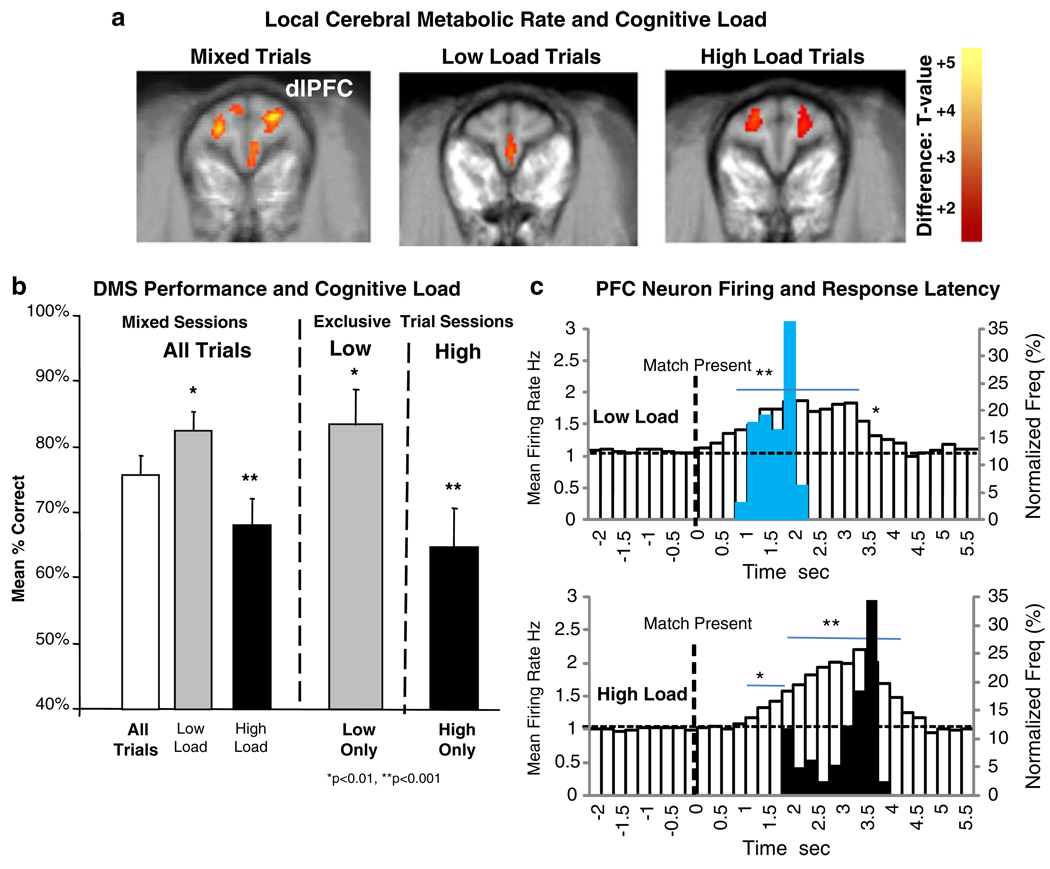
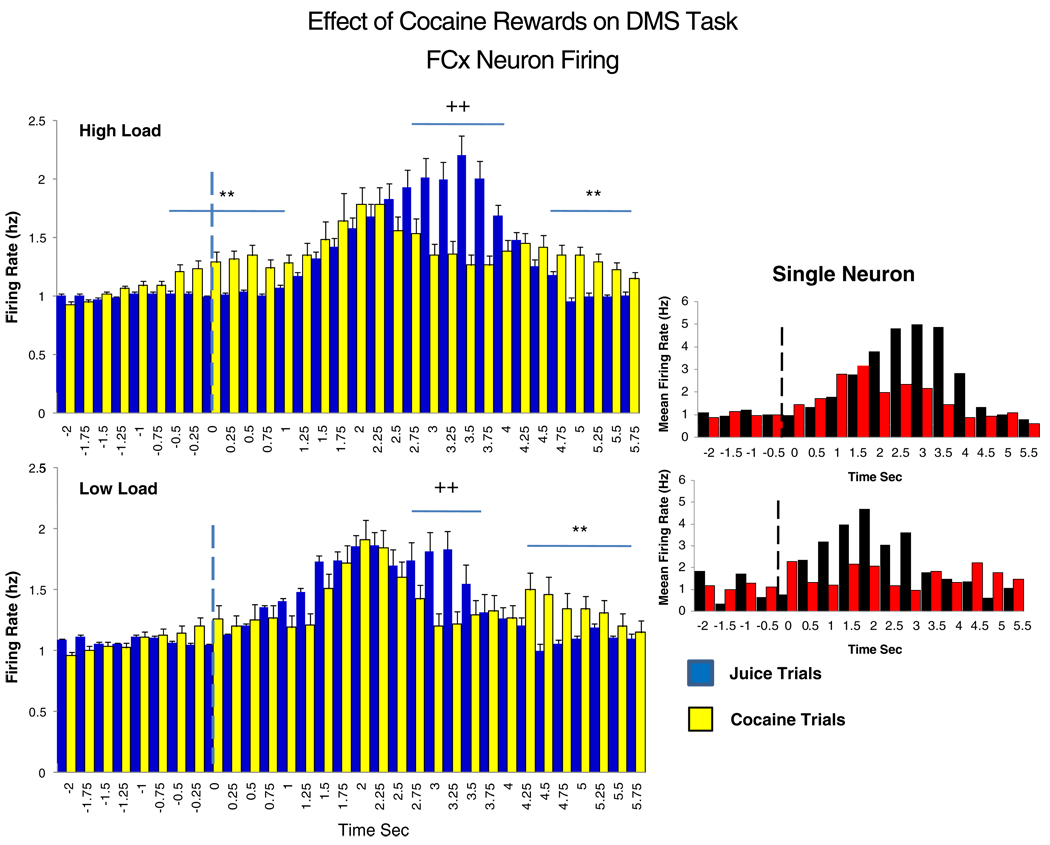
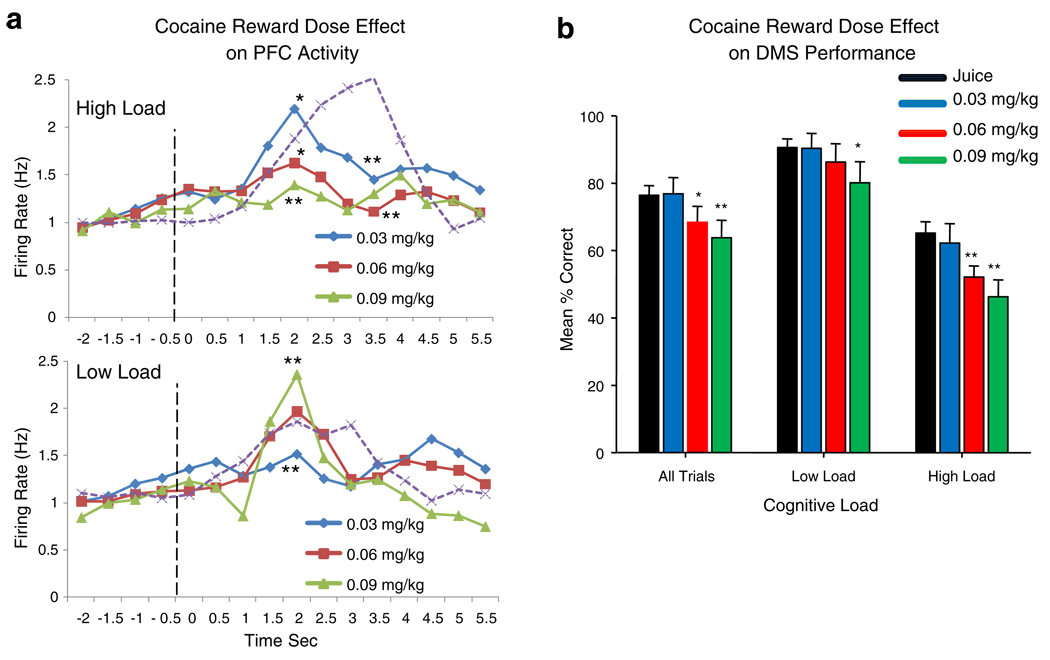
Methods: Nonhuman primates (NHPs) were tested in a delayed-match-to-sample decision making task to determine effects of high vs. low cognitive load trials on single neuron activity and fluorodeoxyglucose-positron emission tomography (FDG-PET) determined metabolic activation of prefrontal cortex when juice vs. intravenous cocaine were employed as rewards for successful performance.

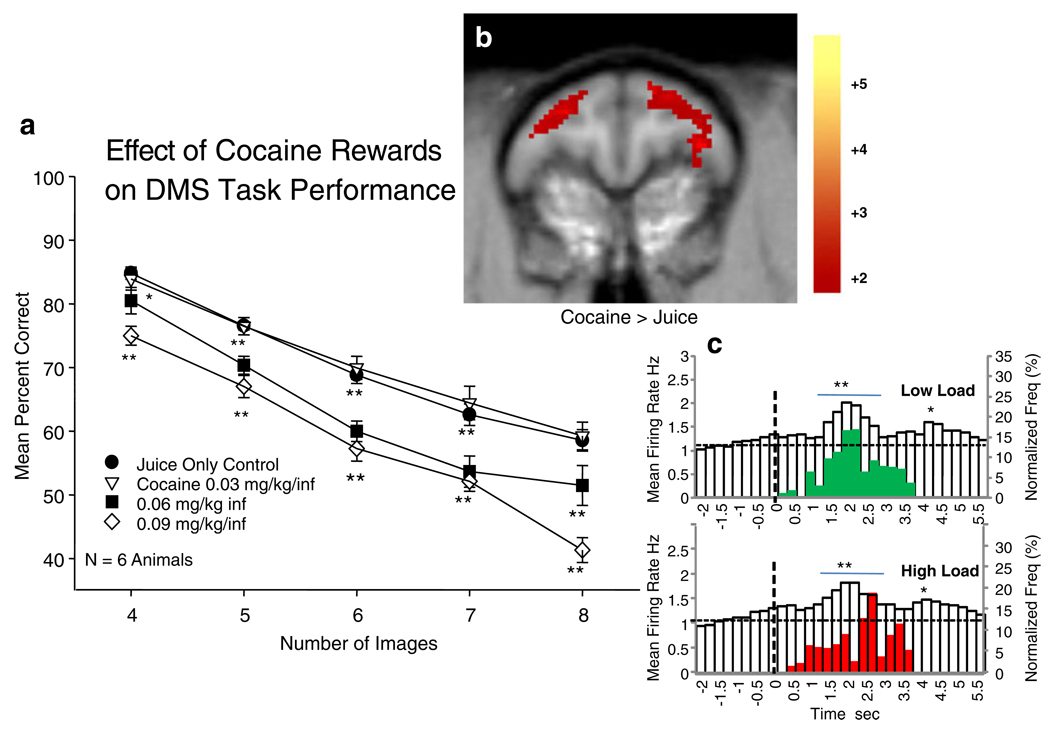
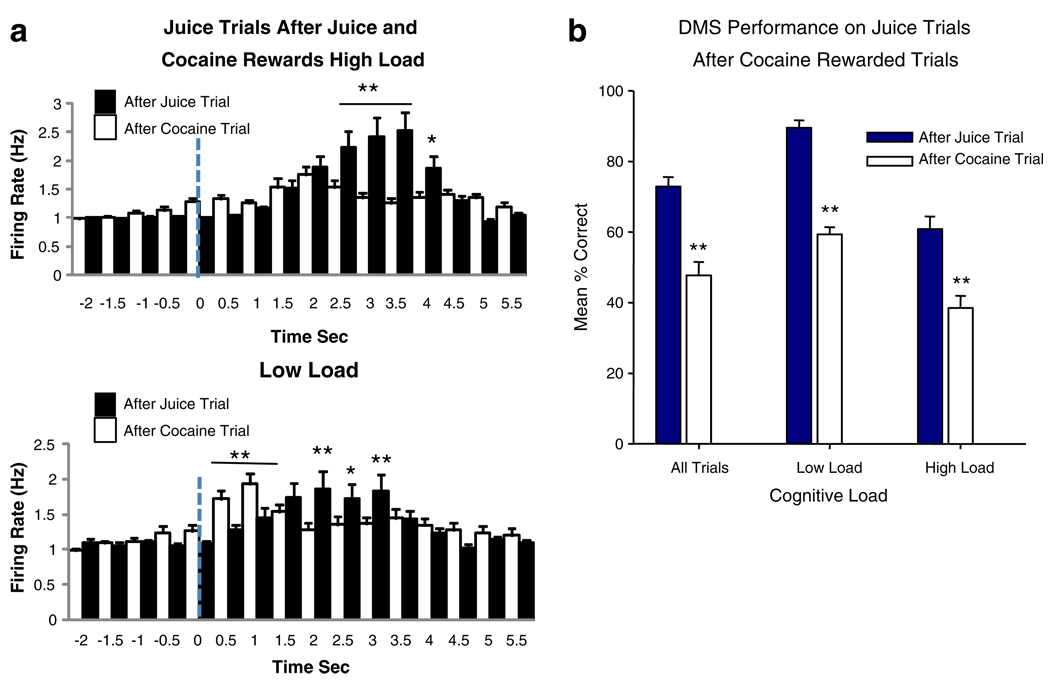
Results: Cognitive processing in prefrontal cortex was altered primarily on high load trials in which cocaine was randomly presented as the signaled and delivered reward on particular trials. The detrimental actions of cocaine rewards were also shown to persist and impair task performance on subsequent juice rewarded trials.

Conclusions: The findings indicate that one of the ways in which cocaine use may disrupt performance of a cognitive task is to alter neural processing in prefrontal cortex when involved in discriminating circumstances on the basis of low vs. high cognitive demand.


Figures

Fig. 1
Fig. 1
Delayed match to sample (DMS) task: a Schematic of Juice-and Cocaine-rewarded DMS trials. Appearance of Start Ring signals condition for initiation of trial which is started when the cursor (yellow dot) is placed within either ring for 1.0 s. The color of Start Ring (blue for cocaine and yellow for juice) was the signal for the type of reward to be delivered for successful performance at the end of the trial. The remaining series of screen display events after the Start Ring were the same for each trial regardless of type of reward. Placement of the cursor into the Start Ring produced a randomly selected “Sample” clip-art image (Sample P) displayed for 2 s in one of nine different screen positions. Placement of the cursor in the Sample image (Sample R) blanked the screen and initiated the Delay Phase with 1–30 s duration selected randomly on each trial. Time-out of the Delay initiated the Match Phase of the task in which two to eight images appeared on the screen randomly at nine different possible locations, one of which was the previous Sample image. Placement of the cursor into the Sample image for 1.0 s constituted a correct Match response (Match R) followed immediately by delivery of either juice or cocaine reward dependent on the type of trial signaled by the color of the Start Ring. Placement of the cursor into other images for >0.5 s constituted an error causing the screen to blank with no reward delivery. The intertrial interval (ITI) was 10 or 30 s depending on the type of reward (juice or cocaine) delivered. The number of non-match “distracter” images presented with the Sample image in the Match phase varied randomly from one to seven on each trial. All clip-art images in a given session were unique, no Sample or distracter clip-art image was utilized more than once within the same session (100–150 trials/session) and all images were new in each session (Hampson et al. 2004). b Illustration of differences in performance as a function of cognitive load in the DMS task. Upper: percent correct performance in DMS task as a function of duration of delay interval (Delay sec) and number of images presented in the Match phase signified by the five different delay curves plotted for each number of distracter images in the Match phase of the task. The dotted boxes enclose the parameters at the extremes of the continuum of cognitive workload from low (blue) vs. high (red) difficulty (Hampson et al. 2009). Lower: decrease in performance accuracy (% correct) as a function of cognitive load is also shown by the systematic change in response latency in the Match phase of the task plotted for the number of images as a function of increased duration of delay (separate bars)
Fig. 2
Fig. 2
Prefrontal cortex (PFC) recording areas and neuron activity in DMS task. a Upper: areas 6, 8, and 46 of NHP prefrontal cortex which bracketed recording tracks for PFC neurons. Lower: cross section of NHP location of recording probe track near the arcuate sulcus in the premotor area. dlPFC dorsolateral prefrontal cortex, FEF frontal eye fields, dPMC dorsal premotor cortex. b Firing of PFC cells in each phase of the DMS task as a function of low vs. high cognitive load for juice reward trials. The PEHs show mean firing rate across all PFC cells (n=96) for the Start Ring Response, Sample Response, and Match Response at t=0.0 s (dotted line), on low (white bars) vs. high (black bars) cognitive load trials. Asterisks indicate significant differences in mean firing rate stated in text
Fig. 3
Fig. 3
Effect of cognitive load on prefrontal local cerebral metabolic rate (LCMR) during DMS performance on juice reward trials. a [18]FDG PET scan images of LCMR in dorsolateral prefrontal cortex (dlPFC) for either Mixed sessions: all types of trials presented over the full range of parameters (Fig. 1b), or Exclusive sessions: only Low or High Load trials presented during the entire session. Difference images obtained from sessions (≥100 trials) with only Low Load or High load trials compared to Mixed sessions with All types of trials. Level of [18]FDG uptake indicated as voxel × voxel change in color from red to yellow as increasing levels of significance (scale shown at right t-test value) for differences in intensities of label (Porrino et al. 2005). b Differences in mean percent correct performance in DMS sessions corresponding to those in which [18]FDG PET scans were obtained in a. Levels of performance in sessions with only low or high load trials (Exclusive) shown with performance in Mixed sessions in which low and high load trials were randomly distributed among the full range of trials presented (Fig. 1b). Asterisks indicate significant differences (*p<0.01, **p<0.001) in mean performance compared to Mixed Sessions (All Trials). c Mean PEHs of PFC neuron firing rate on low vs. high cognitive load juice reward trials associated with corresponding differences in Match R (Fig. 1a) latency on the same trials. Upper and lower white bar PEHs show changes in mean firing rate of PFC neurons following presentation of Match phase images (0.0 s, dotted line) for respective low vs. high load trials. Blue and black bars superimposed on the PEHs indicate distribution of Match R latencies for the same low and high load trials. Asterisks and horizontal bars indicate mean rates in 0.5 s time bins that differ significantly (*p< 0.01, **p<0.001) from mean pre-Match phase (−2.0 to 0.0 s) baseline rate
Fig. 4
Fig. 4
Effects of cocaine reward trials on DMS task performance and PFC activity as a function of cognitive load. a Dose effect of cocaine reward infusion (0.03–0.09 mg/kg/inf) on mean DMS performance as a function of increased number of Match phase images in sessions with both cocaine (40%) and juice (60%) reward trials. Asterisks indicate significant differences (*p<0.01, **p<0.001) from Control (juice reward) sessions. b [18]FDG PET scan difference image between juice only and Mixed trial cocaine+juice reward sessions showing increased activation of dlPFC during cocaine + juice reward sessions (Cocaine > Juice) compared to sessions with only juice reward trials. Color bar at right indicates degree of significance with respect to t values as in Fig. 1a. c Mean PEHs of PFC neuron firing rates in Match phase on low vs. high cognitive load cocaine reward trials from the same sessions as in a (summed across all dose levels) plotted with superimposed Match R latencies (red and green bars) on the same trials (see Fig. 3c). Presentation of Match phase images at t=0.0 s (dotted line). Superimposed bars (green, low load; red, high load) indicate normalized frequency distributions of Match R latencies on the same cocaine rewarded trials. Asterisks and horizontal bars indicate time bins rates that differ significantly (*p<0.01, **p<0.001) from pre-Match phase baseline (−2.0 to 0.0 s)
Fig. 5
Fig. 5
Detailed comparison of PFC neuron firing changes on cocaine vs. juice rewarded trials as a function of low vs. high cognitive load. PEHs show mean (±SEM) firing rate of PFC neurons at 250 ms resolution following Match phase onset vertical (dotted line) for cocaine (yellow bars) vs. juice (blue bars) reward on high and low cognitive load trials within the same sessions. Inset: Example of similar firing changes of a single PFC neuron during a single cocaine/juice session for cocaine (red bars) vs. juice (black bars) reward trials. Asterisks (**cocaine > juice) and plusses (++juice > cocaine) indicate significant differences (p< 0.001) over respective 250 ms time bins (horizontal bars)
Fig. 6
Fig. 6
Dose effect of cocaine signaled rewards on PFC neuron activity and DMS performance as a function of cognitive load. a Effects of different doses (0.03–0.09 mg/kg/inf) of cocaine reward on Match phase mean PFC neuron firing rate on high and low cognitive load trials. Dotted curves show mean PFC neuron firing rates for the same cells on high and low load juice reward trials. Asterisks indicate significant differences (*p<0.01, **p<0.001) for cocaine vs. juice (dotted curves) reward trials at the indicated time bins for different dose levels. b Performance differences (mean % correct) related to cocaine reward trials for different cocaine reward dose levels on low vs. high cognitive load trials compared to performance across all trials (All Trials) within the same sessions. Asterisks indicate significant differences (*p<0.01, **p<0.001) in mean % correct for cocaine vs. juice reward trials within the same sessions
Fig. 7
Fig. 7
Effects of cocaine and juice reward delivery on the next (immediately following) juice reward trial. a PFC neuron firing in Match phase on high and low load juice rewarded trials that were immediately preceded by either cocaine (white bars), or juice (black bars) rewarded trials. Asterisks and horizontal bars indicate significant differences in firing rate (*p<0.01, **p<0.001) between juice trials preceded by cocaine vs. juice rewards. b Performance (mean % correct) on juice trials that followed either cocaine (white bars) or a juice (black bars) rewarded trial. Differences are shown for all trials presented (All trials) and for only high vs. low load trials in the same sessions. Asterisks indicate significant differences (**p<0.001) in mean % correct for juice trials that followed cocaine vs. juice rewarded trials

Similar articles

Cited by

References

    1. Adinoff B, Devous MD, Sr, Cooper DB, Best SE, Chandler P, Harris T, Cervin CA, Cullum CM. Resting regional cerebral blood flow and gambling task performance in cocaine-dependent subjects and healthy comparison subjects. Am J Psychiatry. 2003;160:1892–1894. - PubMed
    1. Ashby FG, Spiering BJ. The neurobiology of category learning. Behav Cogn Neurosci Rev. 2004;3:101–113. - PubMed
    1. Bechara A, Martin EM. Impaired decision making related to working memory deficits in individuals with substance addictions. Neuropsychology. 2004;18:152–162. - PubMed
    1. Bechara A, Dolan S, Denburg N, Hindes A, Anderson SW, Nathan PE. Decision-making deficits, linked to a dysfunctional ventromedial prefrontal cortex, revealed in alcohol and stimulant abusers. Neuropsychologia. 2001;39:376–389. - PubMed
    1. Berns GS. Functional neural imaging. Life Sci. 1999;65:2531–2540. - PubMed

Publication types

MeSH terms

Substances

LinkOut - more resources