

Perirhinal cortex hyperexcitability in pilocarpine-treated epileptic rats
- PMID: 20865722
- PMCID: PMC4878905
- DOI: 10.1002/hipo.20785
Perirhinal cortex hyperexcitability in pilocarpine-treated epileptic rats
Abstract
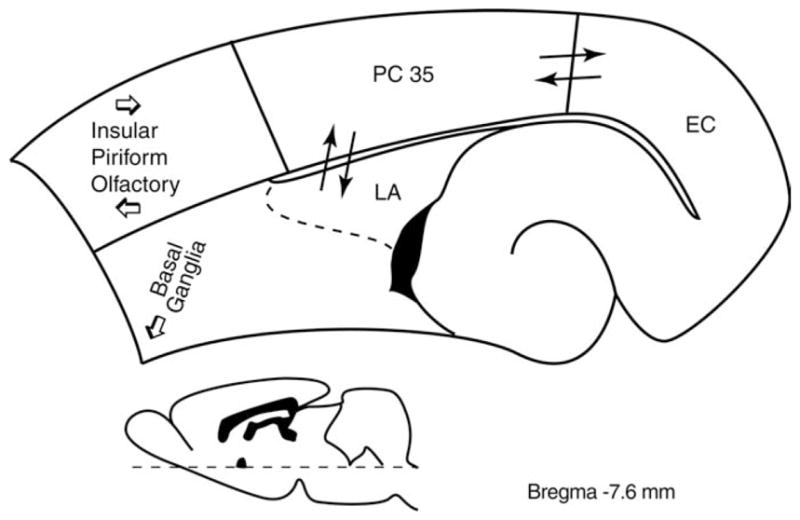
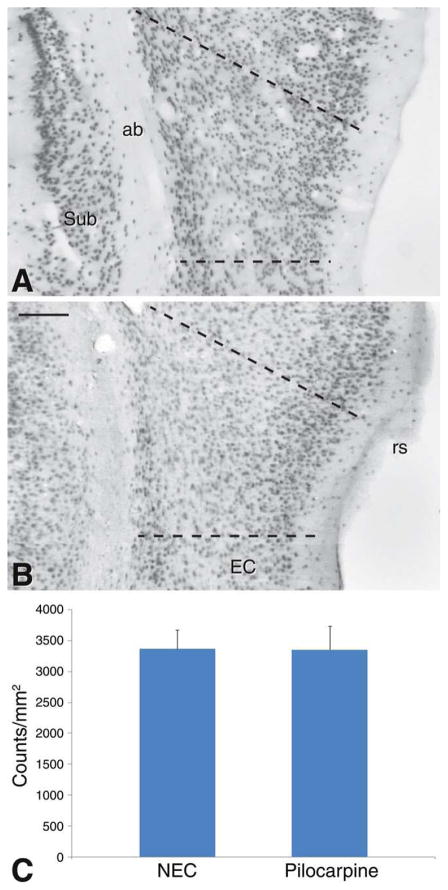
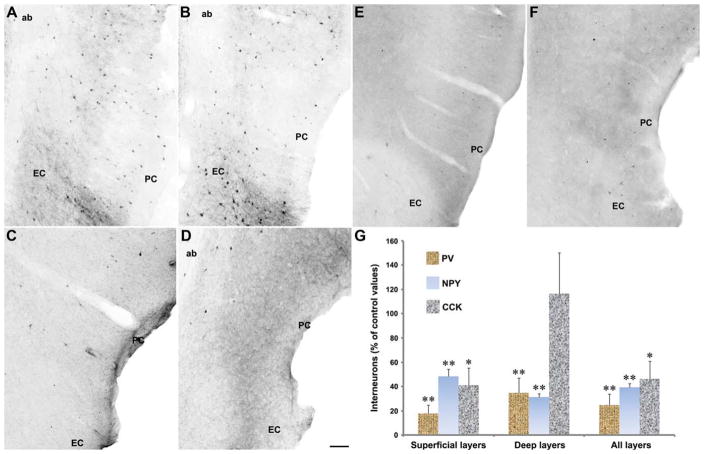
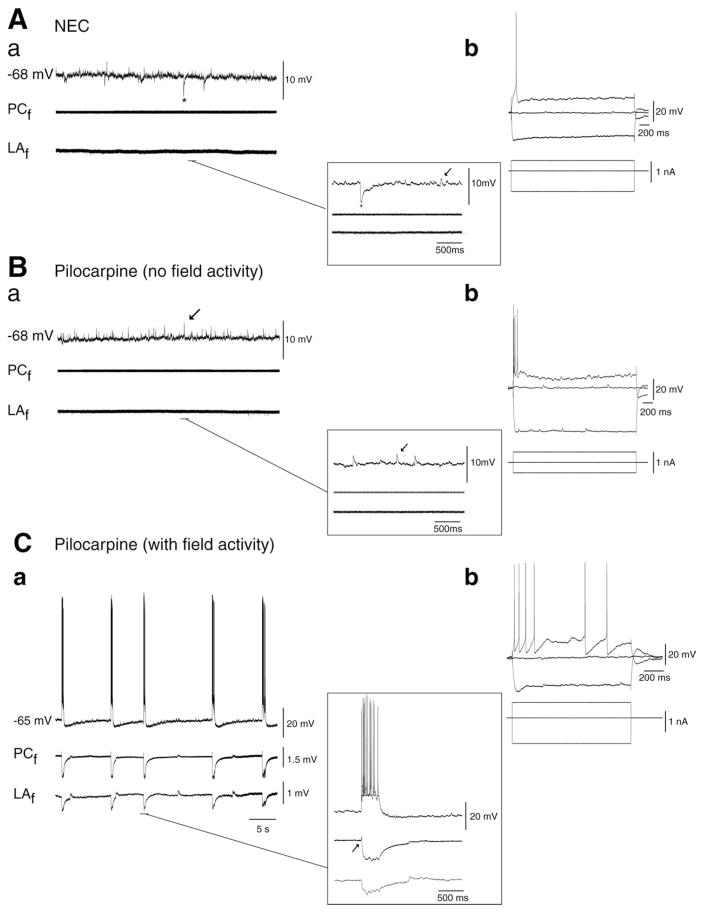
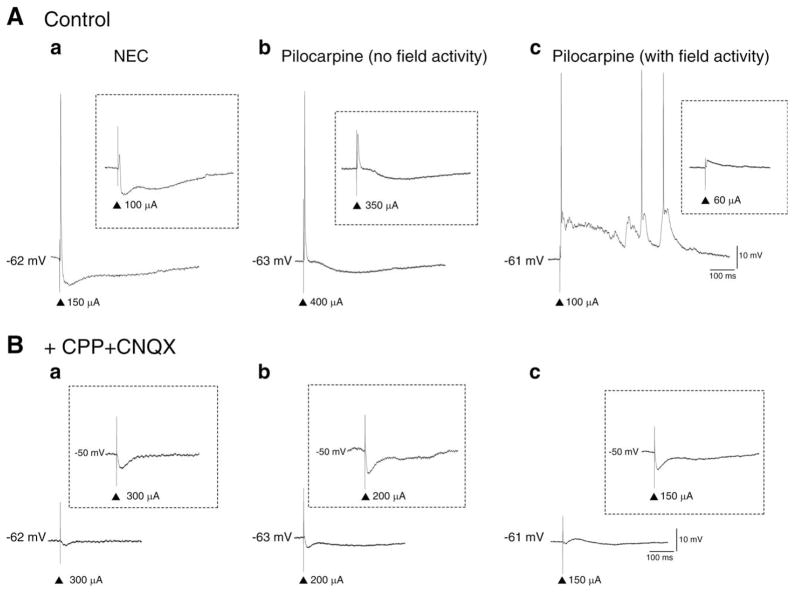
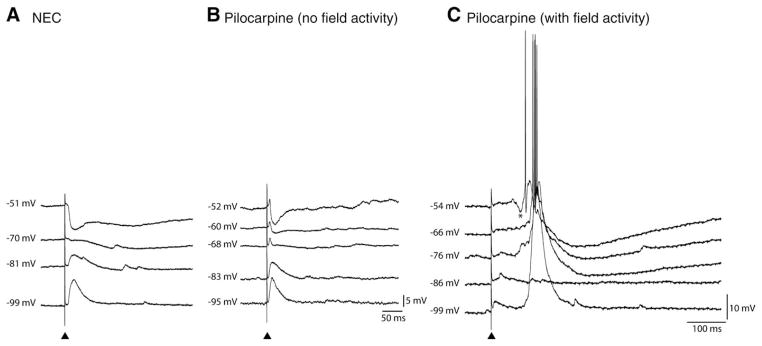
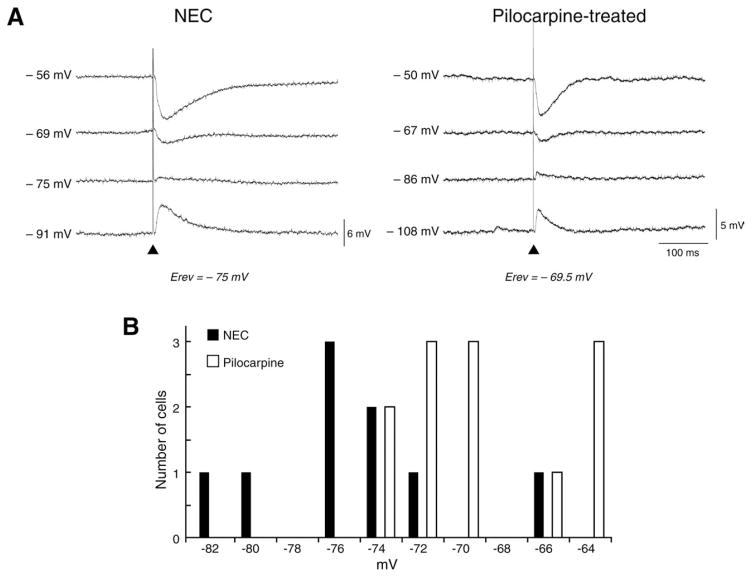
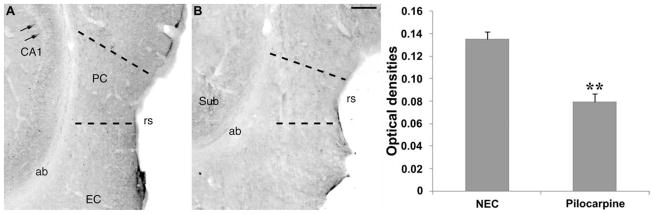
The perirhinal cortex (PC), which is heavily connected with several epileptogenic regions of the limbic system such as the entorhinal cortex and amygdala, is involved in the generation and spread of seizures. However, the functional alterations occurring within an epileptic PC network are unknown. Here, we analyzed this issue by using in vitro electrophysiology and immunohistochemistry in brain tissue obtained from pilocarpine-treated epileptic rats and age-matched, nonepileptic controls (NECs). Neurons recorded intracellularly from the PC deep layers in the two experimental groups had similar intrinsic and firing properties and generated spontaneous depolarizing and hyperpolarizing postsynaptic potentials with comparable duration and amplitude. However, spontaneous and stimulus-induced epileptiform discharges were seen with field potential recordings in over one-fifth of pilocarpine-treated slices but never in NEC tissue. These network events were reduced in duration by antagonizing NMDA receptors and abolished by NMDA + non-NMDA glutamatergic receptor antagonists. Pharmacologically isolated isolated inhibitory postsynaptic potentials had reversal potentials for the early GABA(A) receptor-mediated component that were significantly more depolarized in pilocarpine-treated cells. Experiments with a potassium-chloride cotransporter 2 antibody identified, in pilocarpine-treated PC, a significant immunostaining decrease that could not be explained by neuronal loss. However, interneurons expressing parvalbumin and neuropeptide Y were found to be decreased throughout the PC, whereas cholecystokinin-positive cells were diminished in superficial layers. These findings demonstrate synaptic hyperexcitability that is contributed by attenuated inhibition in the PC of pilocarpine-treated epileptic rats and underscore the role of PC networks in temporal lobe epilepsy.
Copyright © 2010 Wiley-Liss, Inc.
Figures
Similar articles
-
Altered inhibition in lateral amygdala networks in a rat model of temporal lobe epilepsy.J Neurophysiol. 2006 Apr;95(4):2143-54. doi: 10.1152/jn.01217.2005. Epub 2005 Dec 28. J Neurophysiol. 2006. PMID: 16381802
-
Network hyperexcitability within the deep layers of the pilocarpine-treated rat entorhinal cortex.J Physiol. 2008 Apr 1;586(7):1867-83. doi: 10.1113/jphysiol.2007.146159. Epub 2008 Jan 31. J Physiol. 2008. PMID: 18238812 Free PMC article.
-
In vitro ictogenesis and parahippocampal networks in a rodent model of temporal lobe epilepsy.Neurobiol Dis. 2010 Sep;39(3):372-80. doi: 10.1016/j.nbd.2010.05.003. Epub 2010 May 7. Neurobiol Dis. 2010. PMID: 20452424 Free PMC article.
-
Network and pharmacological mechanisms leading to epileptiform synchronization in the limbic system in vitro.Prog Neurobiol. 2002 Oct;68(3):167-207. doi: 10.1016/s0301-0082(02)00077-1. Prog Neurobiol. 2002. PMID: 12450487 Review.
-
Perirhinal cortex and temporal lobe epilepsy.Front Cell Neurosci. 2013 Aug 29;7:130. doi: 10.3389/fncel.2013.00130. Front Cell Neurosci. 2013. PMID: 24009554 Free PMC article. Review.
Cited by
-
Preoperative automated fibre quantification predicts postoperative seizure outcome in temporal lobe epilepsy.Brain. 2017 Jan;140(1):68-82. doi: 10.1093/brain/aww280. Epub 2016 Nov 15. Brain. 2017. PMID: 28031219 Free PMC article.
-
Dysfunctional epileptic neuronal circuits and dysmorphic dendritic spines are mitigated by platelet-activating factor receptor antagonism.Sci Rep. 2016 Jul 22;6:30298. doi: 10.1038/srep30298. Sci Rep. 2016. PMID: 27444269 Free PMC article.
-
Seizures as imbalanced up states: excitatory and inhibitory conductances during seizure-like events.J Neurophysiol. 2013 Mar;109(5):1296-306. doi: 10.1152/jn.00232.2012. Epub 2012 Dec 5. J Neurophysiol. 2013. PMID: 23221405 Free PMC article.
-
GABAergic synchronization in the limbic system and its role in the generation of epileptiform activity.Prog Neurobiol. 2011 Oct;95(2):104-32. doi: 10.1016/j.pneurobio.2011.07.003. Epub 2011 Jul 23. Prog Neurobiol. 2011. PMID: 21802488 Free PMC article. Review.
-
Pathophysiogenesis of mesial temporal lobe epilepsy: is prevention of damage antiepileptogenic?Curr Med Chem. 2014;21(6):663-88. doi: 10.2174/0929867320666131119152201. Curr Med Chem. 2014. PMID: 24251566 Free PMC article. Review.
References
-
- Bartolomei F, Barbeau E, Gavaret M, Guye M, McGonigal A, Régis J, Chauvel P. Cortical stimulation study of the role of rhinal cortex in déjà vu and reminiscence of memories. Neurology. 2004;63:858–864. - PubMed
-
- Benini R, Avoli M. Altered inhibition in lateral amygdala networks in a rat model of temporal lobe epilepsy. J Neurophysiol. 2006;95:2143–2154. - PubMed
-
- Benini R, D’Antuono M, Pralong E, Avoli M. Involvement of amygdala networks in epileptiform synchronization in vitro. Neuroscience. 2003;120:75–84. - PubMed
