

Multicomponent T2* mapping of knee cartilage: technical feasibility ex vivo
- PMID: 20865752
- PMCID: PMC2965791
- DOI: 10.1002/mrm.22450
Multicomponent T2* mapping of knee cartilage: technical feasibility ex vivo
Abstract
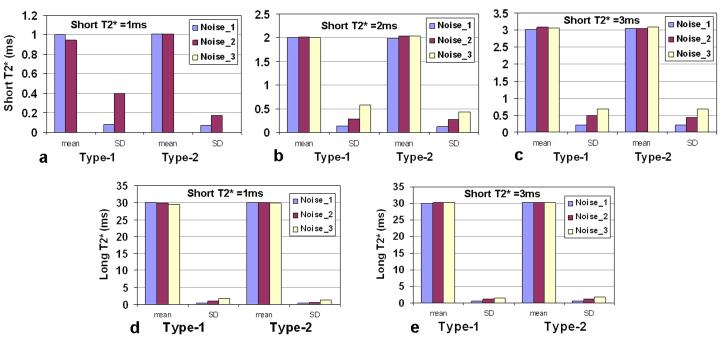
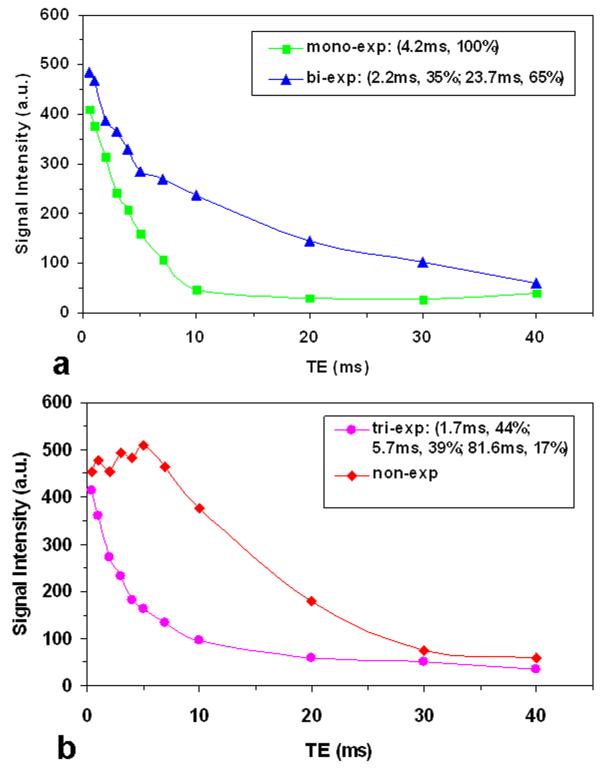
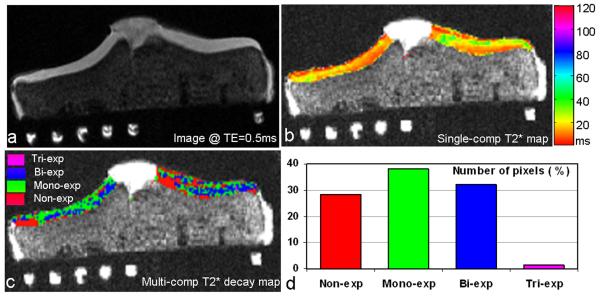
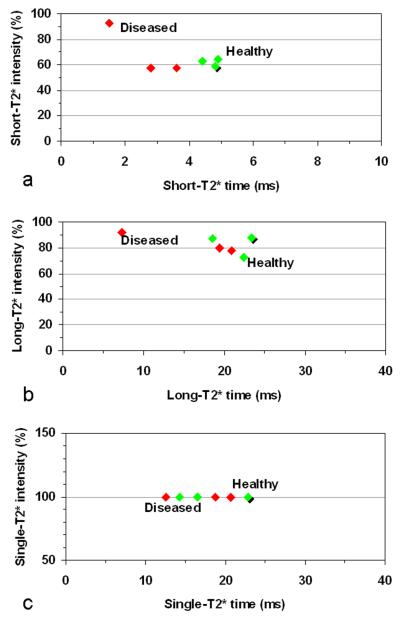
Disorganization of collagen fibers is a sign of early-stage cartilage degeneration in osteoarthritic knees. Water molecules trapped within well-organized collagen fibrils would be sensitive to collagen alterations. Multicomponent effective transverse relaxation (T2*) mapping with ultrashort echo time acquisitions is here proposed to probe short T(2) relaxations in those trapped water molecules. Six human tibial plateau explants were scanned on a 3T MRI scanner using a home-developed ultrashort echo time sequence with echo times optimized via Monte Carlo simulations. Time constants and component intensities of T2* decays were calculated at individual pixels, using the nonnegative least squares algorithm. Four T2*-decay types were found: 99% of cartilage pixels having mono-, bi-, or nonexponential decay, and 1% showing triexponential decay. Short T2* was mainly in 1-6 ms, while long T2* was ∼ 22 ms. A map of decay types presented spatial distribution of these T2* decays. These results showed the technical feasibility of multicomponent T2* mapping on human knee cartilage explants.
Figures
References
-
- Blumenkrantz G, Majumdar S. Quantitative magnetic resonance imaging of articular cartilage in osteoarthritis. Eur Cell Mater. 2007;13:75–86. - PubMed
-
- Lattanzio PJ, Marshall KW, Damyanovich AZ, Peemoeller H. Macromolecule and water magnetization exchange modeling in articular cartilage. Magn Reson Med. 2000;44:840–851. - PubMed
-
- Lohmander LS. Markers of altered metabolism in osteoarthritis. J Rheumatol Suppl. 2004;70:28–35. - PubMed
-
- Gay S, Miller EJ. Semper bonis artibus. Gustav Fischer Verlag; Germany: 1978. Collagen in the physiology and pathology of connective tissue; p. 109.
-
- Burstein D, Velyvis J, Scott KT, Stock KW, Kim YJ, Jaramillo D, Boutin RD, Gray ML. Protocol issues for delayed Gd(DTPA)(2-)-enhanced MRI (dGEMRIC) for clinical evaluation of articular cartilage. Magn Reson Med. 2001;45:36–41. - PubMed
Publication types
MeSH terms
Grants and funding
LinkOut - more resources
Full Text Sources
Other Literature Sources
Medical
