. 2010 Sep 21:1:77.
doi: 10.1038/ncomms1082.

The complete sequence of the smallest known nuclear genome from the microsporidian Encephalitozoon intestinalis

Affiliations

The complete sequence of the smallest known nuclear genome from the microsporidian Encephalitozoon intestinalis

Nicolas Corradi et al. Nat Commun. .

Abstract

The genome of the microsporidia Encephalitozoon cuniculi is widely recognized as a model for extreme reduction and compaction. At only 2.9 Mbp, the genome encodes approximately 2,000 densely packed genes and little else. However, the nuclear genome of its sister, Encephalitozoon intestinalis, is even more reduced; at 2.3 Mbp, it represents a 20% reduction from an already severely compacted genome, raising the question, what else can be lost? In this paper, we describe the complete sequence of the E. intestinalis genome and its comparison with that of E. cuniculi. The two species share a conserved gene content, order and density over most of their genomes. The exceptions are the subtelomeric regions, where E. intestinalis chromosomes are missing large gene blocks of sequence found in E. cuniculi. In the remaining gene-dense chromosome 'cores', the diminutive intergenic sequences and introns are actually more highly conserved than the genes themselves, suggesting that they have reached the limits of reduction for a fully functional genome.


Figures

Figure 1
Figure 1. Comparison between the chromosomes of E. intestinalis and E. cuniculi.
Comparison of the 11 chromosomes of E. intestinalis (left side) and E. cuniculi (right side), with the total assembled size for each indicated below the name. Difference in the relative length of orthologous protein-coding genes is summarized in a pie chart above each chromosome. Blue, brown and beige colours represent the portion of proteins that are, respectively, shorter, identical or longer in E. intestinalis compared with E. cuniculi orthologues. Chromosome 'cores' are shown in red and the size (S) and average intergenic regions (I) of each core are indicated under it. Gene rearrangements, inversions and events of gene losses and gains between species are shown as coloured triangles. Black triangles represent the location of genes absent from E. intestinalis. Light blue rectangles represent the location of genes absent from E. cuniculi. Yellow rectangles represent genes that were previously unannotated in E. cuniculi that have been identified by comparisons with E. intestinalis. In addition, it was evident for many other genes that the previous annotation used the wrong ATG codon. The newly annotated version of the E. cuniculi genome is available as Supplementary Data 1. Dark orange triangles represent genes duplicated and rearranged between chromosomes of E. intestinalis (chromosome number shown above the rectangle). Dark violet arrows represent genes transposed from another chromosome (original chromosome number shown above the rectangle). Chromosomal inversions are shown in dark blue. SSU, small subunit ribosomal RNA gene.
Figure 2
Figure 2. Genome reduction in E. intestinalis.
A comparison between the genome assembly of E. intestinalis (>95% assembled) with the available assembly of E. cuniculi (85% assembled) shows that the vast majority of genes that are absent in E. intestinalis are located at the chromosome ends in E. cuniculi (left, n=174, 161 ORFs and 13 genes of identified function, Supplementary Data 2). At the chromosome cores, gene losses and shortening of intergenic regions account for most of the reduction in size of E. intestinalis, whereas reduction in gene length is negligible. * Includes their surrounding intergenic spaces. ¥Calculations are based on orthologous intergenic regions only.
Figure 3
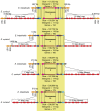
Figure 3. Chromosome ends reduction in E. intestinalis.
Structural comparisons between chromosomes 1, 4, 5 and 10 of E. intestinalis and E. cuniculi. Genes and their transcriptional direction are represented by rectangular arrows. The rDNA operon linked to chromosome ends is shown in orange. Genes that are absent from the E. intestinalis assembly are shown in red, whereas genes present in E. intestinalis but absent from E. cuniculi are grey. The chromosome 'cores' (shaded in a yellow box) contain long blocks of absolute colinearity between the two genomes: only the first and last four orthologues in these 'cores' are shown (as coloured boxes with directional arrows) for convenience. The total size of each 'core' is indicated for both species, along with the average length of its intergenic regions and the number of genes (including tRNAs and 5S rDNAs). SSU, small subunit ribosomal RNA gene; LSU, large subunit ribosomal RNA gene.
Figure 4
Figure 4. Conservation of non-coding regions in Encephalitozoon.
Schematic representation to scale of 12 orthologous genes (Ecu01_1080 to Ecu01_1170) and their intergenic spaces located on chromosome 1 of E. intestinalis (top) and E. cuniculi (bottom). Genes and orientations are represented by rectangular olive green arrows; intergenic regions are shown in black. The scale (left) represents the genetic distance between intergenic spaces and genes (number of substitutions per synonymous site for genes, or in total for intergenic regions). Grey rectangles represent the genetic distance between genes, whereas black rectangles represent the genetic distance between intergenic regions, the progression of which is tracked by the red line. With a single exception (the 14 bp intergenic region), the intergenic spaces are always more highly conserved than the genes they surround.

References

    1. Corradi N. & Keeling P. J. Microsporidia: a journey through radical taxonomical revisions. Fungal Biol. Rev. 23, 1–8 (2009).
    1. James T. Y. et al.. Reconstructing the early evolution of Fungi using a six-gene phylogeny. Nature 443, 818–822 (2006). - PubMed
    1. Katinka M. D. et al.. Genome sequence and gene compaction of the eukaryote parasite Encephalitozoon cuniculi. Nature 414, 450–453 (2001). - PubMed
    1. Lee S. C. et al.. Microsporidia evolved from ancestral sexual fungi. Curr. Biol. 18, 1675–1679 (2008). - PMC - PubMed
    1. Van de Peer Y., Ben Ali A. & Meyer A. Microsporidia: accumulating molecular evidence that a group of amitochondriate and suspectedly primitive eukaryotes are just curious fungi. Gene 246, 1–8 (2000). - PubMed

Publication types

MeSH terms