

doi: 10.1103/PhysRevLett.104.228102.
Epub 2010 Jun 1.
Dendritic actin filament nucleation causes traveling waves and patches
Affiliations
- PMID: 20867207
- PMCID: PMC2947330
- DOI: 10.1103/PhysRevLett.104.228102
Item in Clipboard
Dendritic actin filament nucleation causes traveling waves and patches
Phys Rev Lett.
.
Abstract
The polymerization of actin via branching at a cell membrane containing nucleation-promoting factors is simulated using a stochastic-growth methodology. The polymerized-actin distribution displays three types of behavior: (a) traveling waves, (b) moving patches, and (c) random fluctuations. Increasing actin concentration causes a transition from patches to waves. The waves and patches move by a treadmilling mechanism not involving myosin II. The effects of downregulation of key proteins on actin wave behavior are evaluated.
Figures

3D network structure (left) and simulated fluorescence (right) for actin wave (red) propagating across three-micron square area of membrane (green). Time difference between frames is 6 sec. Parameters are: katt = 0.025s−1, kdet = 0.009μM−1s−1, Eb = 2.8kBT, knuc = 0.003μM−1s−1, [A] = 22.5μM, and [CP] = 0.25μM. See Supplemental Video 1 for complete time evolution.

Simulated fluorescence of patches obtained with parameters of Fig. 1 but with [A] reduced to 15μM (top row) or [CP] decreased to 0.10μM (bottom row). Images are 12 sec (top row) and 18 sec (bottom row) apart. See Supplemental Videos 2 and 3 for complete time evolution.

Closeup of edge of actin patch at top of Fig. 2 moving to right. Frames are 0.2 sec apart.
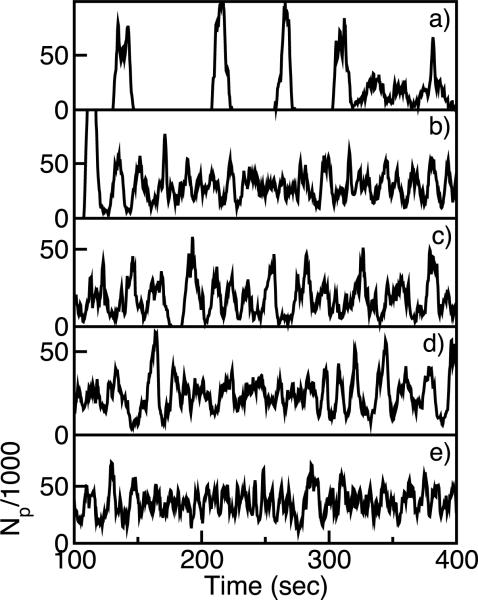
Total number of polymerized subunits Np vs time: a) Baseline parameters as in Fig. 1; b) [CP] decreased to 0.10μM.; c) knuc increased to 0.03μM−1s−1; d) Eb increased to 4.5kBT; e) katt increased to 0.05s−1
References
Publication types
MeSH terms
Substances
Grants and funding
LinkOut - more resources
Full Text Sources