

doi: 10.1103/PhysRevLett.105.037401.
Epub 2010 Jul 14.
Resolved sideband emission of InAs/GaAs quantum dots strained by surface acoustic waves
Affiliations
- PMID: 20867805
- PMCID: PMC10198564
- DOI: 10.1103/PhysRevLett.105.037401
Item in Clipboard
Resolved sideband emission of InAs/GaAs quantum dots strained by surface acoustic waves
Phys Rev Lett.
.
Abstract
The dynamic response of InAs/GaAs self-assembled quantum dots (QDs) to strain is studied experimentally by periodically modulating the QDs with a surface acoustic wave and measuring the QD fluorescence with photoluminescence and resonant spectroscopy. When the acoustic frequency is larger than the QD linewidth, we resolve phonon sidebands in the QD fluorescence spectrum. Using a resonant pump laser, we have demonstrated optical frequency conversion via the dynamically modulated QD, which is the physical mechanism underlying laser sideband cooling a nanomechanical resonator by means of an embedded QD.
Figures
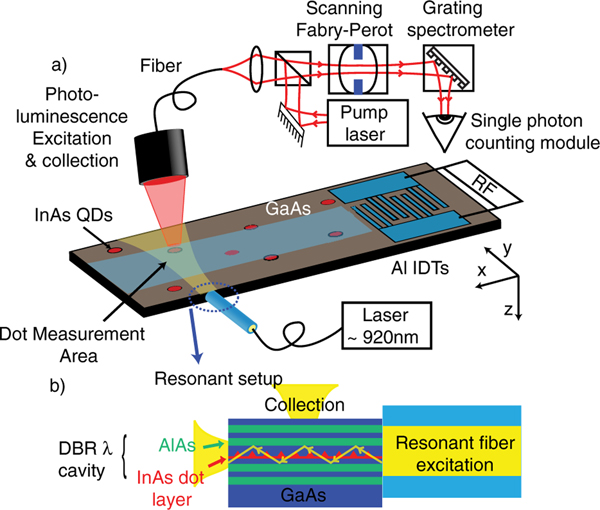
(color online). (a) Schematic of the experimental setup. (b) Resonant fiber-waveguide coupling (not to scale).
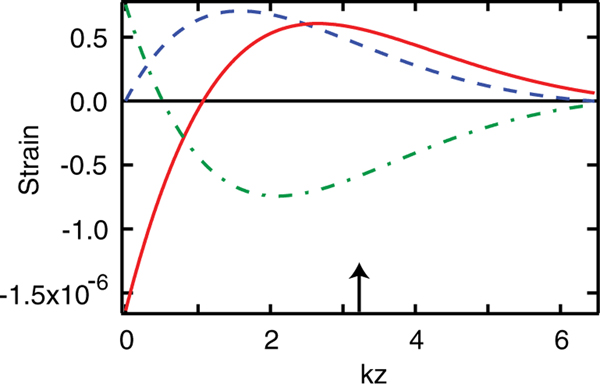
(color online). Amplitude of the SAW nonvanishing strains vs depth for a surface displacement of 1 pm at a frequency of 1 GHz. (solid red line) and (dash-dotted green line) are proportional to , while (dashed blue line) is proportional to . Here and . The black arrow corresponds to the sample parameters described in this Letter: a SAW wavelength of and a QD depth of z = 1.5 μm.
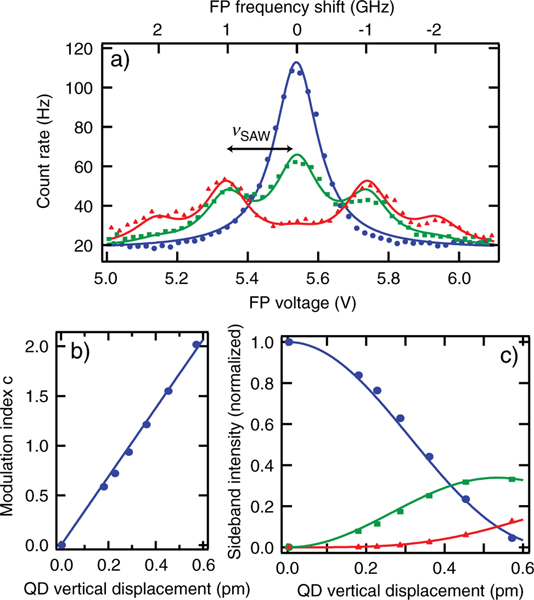
(color online). (a) QD fluorescence spectra at 921.5 nm with no SAW excitation (blue circles), and SAW excitation characterized by QD displacements (green squares), and (red triangles). Lines are fits to Eq. (2) to extract the modulation index . Each FP spectrum is measured in 300 seconds. (b) Modulation index vs ; . (c) Peak intensities of the central QD peak (blue circles) and first- and second-order sidebands (green squares, red triangles) vs QD displacement . Lines are prediction of Eq. (2).
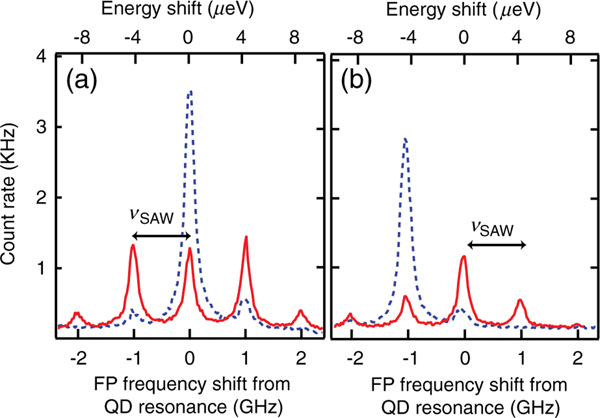
(color online). The blue dashed curves correspond to a QD vertical displacement of , and the red solid curves correspond to . The QD emission wavelength is 924 nm. Each curve corresponds to 30 seconds of data. (a) The QD is weakly driven on resonance and the spectrum of the resulting QD fluorescence is resolved with the scanning FP interferometer. (b) The QD is driven by a laser tuned 1.05 GHz below the QD resonance (red sideband). The fluorescence spectrum becomes asymmetric, with average photon energy greater than the energy of the laser photons.
References
-
- Fry P. et al., Phys. Status Solidi A 178, 269 (2000).
-
- Vogel MM et al., Appl. Phys. Lett 91, 051904 (2007).
-
- Seidl S. et al., Appl. Phys. Lett 88, 203113 (2006).
-
- Itskevich IE et al., Phys. Rev. B 58, R4250 (1998).
-
- Liang Y-H, Arai Y, Ozasa K, Ohashi M, and T suchida E, Physica (Amsterdam) 36E, 1 (2007).
Grants and funding
LinkOut - more resources
Full Text Sources