. 2010 Sep 27:5:17.
doi: 10.1186/1750-2187-5-17.

The adaptor protein SH2B1β reduces hydrogen peroxide-induced cell death in PC12 cells and hippocampal neurons

Affiliations

The adaptor protein SH2B1β reduces hydrogen peroxide-induced cell death in PC12 cells and hippocampal neurons

Wan-Chen Lu et al. J Mol Signal. .

Abstract

Background: SH2B1β is a signaling adaptor protein that has been shown to promote neuronal differentiation in PC12 cells and is necessary for the survival of sympathetic neurons. However, the mechanism by which SH2B1β may influence cell survival is not known.

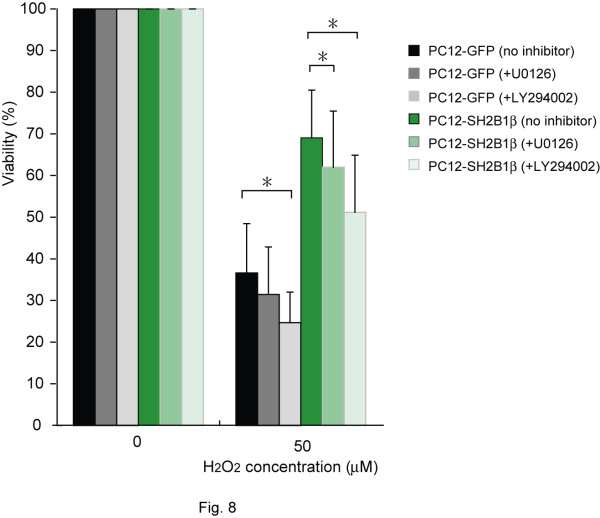
Results: In this study, we investigated the role of SH2B1β in oxidative stress-induced cell death. Our results suggest that overexpressing SH2B1β reduced H2O2-induced, caspase 3-dependent apoptosis in PC12 cells and hippocampal neurons. In response to H2O2, overexpressing SH2B1β enhanced PI3K (phosphatidylinositol 3-kinas)-AKT (protein kinase B) and MEK (MAPK/ERK kinase)-extracellular-signal regulated kinases 1 and 2 (ERK1/2) signaling pathways. We further demonstrated that SH2B1β was able to reduce H2O2-induced nuclear localization of FoxO1 and 3a transcription factors, which lie downstream of PI3K-AKT and MEK-ERK1/2 pathways. Moreover, overexpressing SH2B1β reduced the expression of Fas ligand (FasL), one of the target genes of FoxOs.

Conclusions: Overexpressing the adaptor protein SH2B1β enhanced H2O2-induced PI3K-AKT and MEK-ERK1/2 signaling, reduced nucleus-localized FoxOs and the expression of a pro-apoptotic gene, FasL.


Figures

Figure 1
Figure 1
Cell survival of H2O2-treated PC12-GFP and PC12-SH2B1β cells. PC12-GFP cells (A, C, E) and PC12-SH2B1β cells (B, D, F) were treated with 0 (A, B), 50 (C, D), or 100 (E, F) μM H2O2 for 24 h. Representative images of live cells were shown. (G) Parental PC12 cells were treated with 100 μM H2O2 for the indicated time points. ROS levels were measured using DHE dye as described in "Materials and Methods". Arrows point to dying cells. Arrowheads point to live cells.
Figure 2
Figure 2
H2O2 -induced cell death and neurite retraction in differentiated PC12-GFP and PC12-SH2B1β cells. PC12-GFP cells (A, C, E) and PC12-SH2B1β cells (B, D, F) were differentiated using 50 ng/ml NGF for 7 days. After overnight incubation in serum-free medium containing 50 ng/ml NGF, both cell lines were treated with 0, 100 or 200 μM H2O2 for 24 h. Representative images were shown (400× magnification).
Figure 3
Figure 3
Cell viability of PC12-GFP and PC12-SH2B1β cells treated with H2O2. PC12-GFP or PC12-SH2B1β cells were treated with the indicated concentrations of H2O2 for 24 h. Cell viability was measured by MTT assays as described in "Materials and Methods". Values are expressed as % of control (untreated samples) for each experiment, with the values obtained for untreated cells taken as 100%. Values are expressed as mean ± S.E. from three independent experiments. The asterisks represent significant differences compared with control cells (*, p < 0.05).
Figure 4
Figure 4
H2O2 induces caspase 3-dependent apoptosis in PC12-GFP and PC12-SH2B1β cells. PC12-GFP and PC12-SH2B1β cells were treated with 0, 100, 200, 300 μM H2O2 for 18 h. Equal amounts of proteins from the lysates were resolved with SDS-PAGE and immunoblotted with (A) anti-caspase 3 (upper panel), or (B) anti-PARP antibody. ERK levels were used as loading controls. For % cells with anti-active caspase 3 staining, cells were treated with 100 or 200 μM H2O2 for 18 h and then subjected to immunofluorescence staining using anti-active caspase 3 antibody (A, lower panel). Percentages of active caspase 3-positive cells were counted from 145-211 cells/condition. (C) Hippocampal neurons from E18 embryos were transiently transfected with GFP, GFP-SH2B1β or GFP-SH2B1β(R555E) and then treated with H2O2 for 18 h. Cells were then subjected to immunofluorescence staining with DAPI (shown in blue) to mark the nucleus. Green fluorescence (GFP) showed the transfected cells. Boxes mark the nucleus and arrows point to the neurites. Enlarged images of the nucleus and neurites are shown on the right panels.
Figure 5
Figure 5
SH2B1β enhances the phosphorylation levels of AKT, ERK1/2 and FoxOs. PC12-GFP and PC12-SH2B1β cells were incubated in serum-free medium overnight followed by H2O2 stimulation with the indicated concentrations for 10 min. Equal amounts of proteins from the lysates were resolved via SDS-PAGE and immunoblotted with (A) anti-GFP; (B) anti-pAKT(Ser473) and anti-AKT; (D) anti-pERK1/2 and anti-ERK1/2; (F) anti-FoxO1 and anti-FoxO3a antibodies. Representative blots were shown. (C) The quantified results of pAKT in PC12-GFP and PC12-SH2B1β cells were shown. The levels of pAKT were normalized to levels of AKT at each condition. The relative level of pAKT at 50 μM of H2O2 in PC12-SH2B1β cells was defined as 100% in each experiment and others were normalized to this value. (E) The levels of pERK1/2 were normalized to total ERK1/2 levels, the relative level of pERK1/2 at 300 μM in PC12-SH2B1β cells was defined as 100% for each experiment and others were normalized to this value. Data are expressed as mean ± S.E. from three (for AKT) or five (for ERK1/2) independent experiments. Arrows point to the phospho-FoxO1 and 3a.
Figure 6
Figure 6
SH2B1β reduces H2O2-induced nuclear distributions of FoxO1 and 3a. PC12-GFP and PC12-SH2B1β cells were incubated in serum-free medium overnight before 0, 100, or 200 μM H2O2 treatment for 10 min, without (A-B) or with 20 μM LY294002 (+LY) (C-D, G-H) or 20 μM U0126 (+U) (E-F, I-J) pretreatment for 30 min. The localization of FoxOs was determined via immunofluorescence staining using anti-FoxO1 (A, C, E, G, I) or anti-FoxO3a (B, D, F, H, J) antibody followed by Alexa Fluor 555-conjugated secondary antibody. Images were taken using inverted Zeiss Axiover 135 fluorescence microscope. Percentage of cells with fluorescence intensity of FoxO1 or FoxO3a in the nucleus higher than in the cytoplasm (N > C) was quantified. A total of 90-110 cells were counted for each condition. For inhibitor assays, results from PC12-GFP cells are shown on the left panels and those from PC12-SH2B1β cells are shown on the right.
Figure 7
Figure 7
SH2B1β reduces H2O2-induced expression of FasL through PI3K-AKT and MEK-ERK1/2. PC12-GFP and PC12-SH2B1β cells were incubated in serum-free medium overnight, before H2O2 (0, 100, or 200 μM) treatment for 4 h without (A) or with 20 μM LY294002 (+LY) (B, C) or 20 μM U0126 (+U) (D, E) pre-treatment for 30 min. The expression of FasL was determined by Q-PCR. The relative levels of FasL were normalized to the expression of GAPDH. The relative expression levels of H2O2-treated samples were normalized to untreated samples in each cell line for each experiment. Values are expressed as mean ± S.E. from three independent experiments and statistically compared using student's t-test (*, P < 0.05). For inhibitor assays, results from PC12-GFP cells are shown on the left panels and those from PC12-SH2B1β cells are shown on the right.
Figure 8
Figure 8
Activation of PI3K-AKT and MEK-ERK1/2 signaling pathways contributes to cell survival in response to H2O2. PC12-GFP or PC12-SH2B1β cells were pre-treated with PI3K inhibitor (LY294002), MEK inhibitor (U0126) or mock-treated 1 h before the addition of H2O2 for 24 h. Cell viability was measured by MTT assays. Values are expressed as % of the respective controls (samples without H2O2 treatment) for each experiment, with the values obtained from respective control cells taken as 100%. Values are expressed as mean ± S.E. from five independent experiments. The asterisks represent significant differences compared between the indicated conditions (*, p < 0.05).

References

    1. Barnham KJ, Masters CL, Bush AI. Neurodegenerative diseases and oxidative stress. Nat Rev Drug Discov. 2004;3(3):205–214. doi: 10.1038/nrd1330. - DOI - PubMed
    1. Everse J, Coates PW. Neurodegeneration and peroxidases. Neurobiol Aging. 2009;30(7):1011–1025. doi: 10.1016/j.neurobiolaging.2007.10.007. - DOI - PubMed
    1. Simonian NA, Coyle JT. Oxidative stress in neurodegenerative diseases. Annu Rev Pharmacol Toxicol. 1996;36:83–106. doi: 10.1146/annurev.pa.36.040196.000503. - DOI - PubMed
    1. Jenner P. Oxidative stress in Parkinson's disease. Ann Neurol. 2003;53(Suppl 3):S26–36. doi: 10.1002/ana.10483. discussion S36-28. - DOI - PubMed
    1. Chan PH. Reactive oxygen radicals in signaling and damage in the ischemic brain. J Cereb Blood Flow Metab. 2001;21(1):2–14. doi: 10.1097/00004647-200101000-00002. - DOI - PubMed