. 2010 Oct;9(5):278-90.

In vivo magnetic resonance imaging and optical imaging comparison of viable and nonviable mesenchymal stem cells with a bifunctional label

Affiliations

In vivo magnetic resonance imaging and optical imaging comparison of viable and nonviable mesenchymal stem cells with a bifunctional label

Elizabeth Jane Sutton et al. Mol Imaging. 2010 Oct.

Abstract

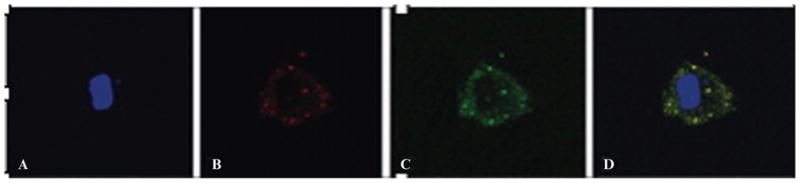
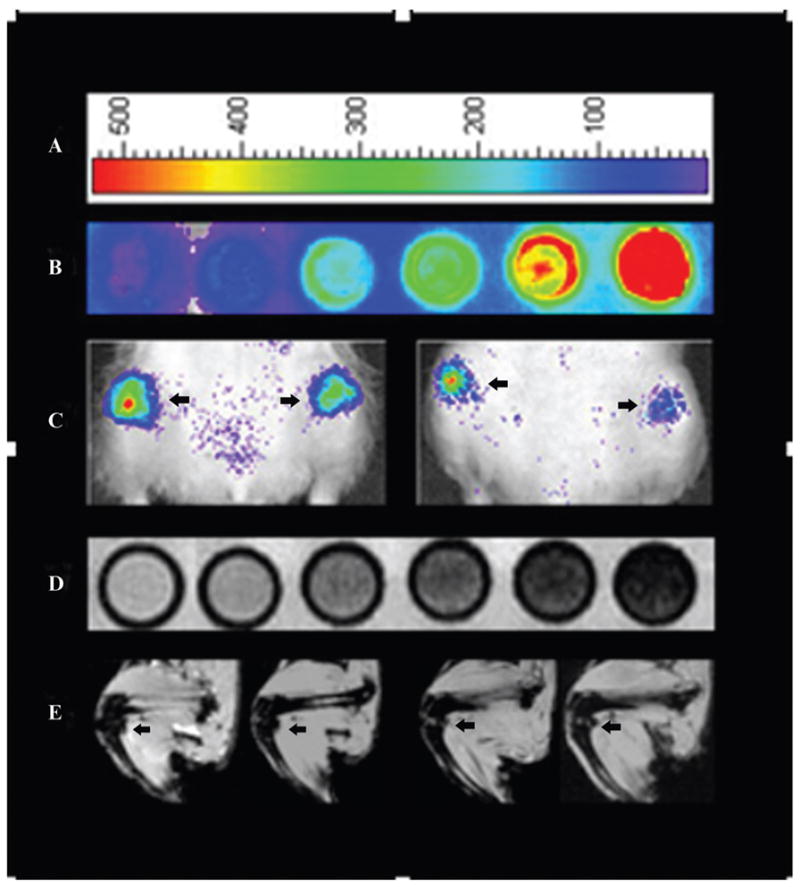
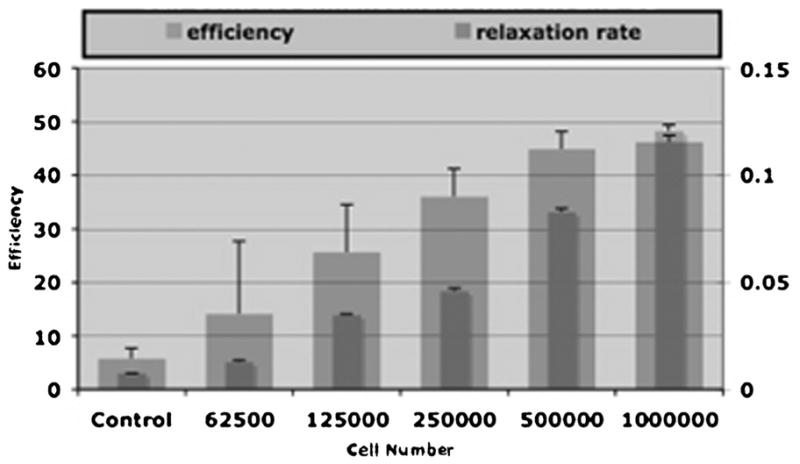
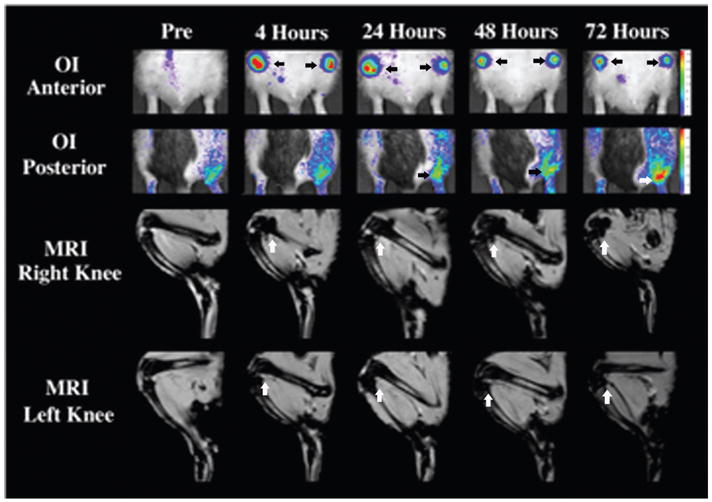
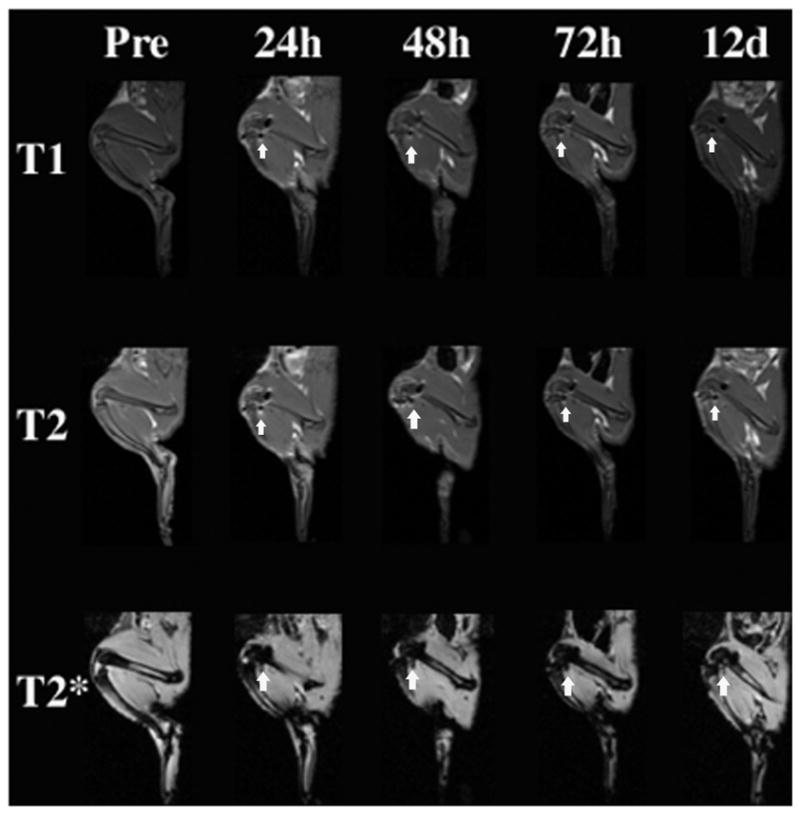
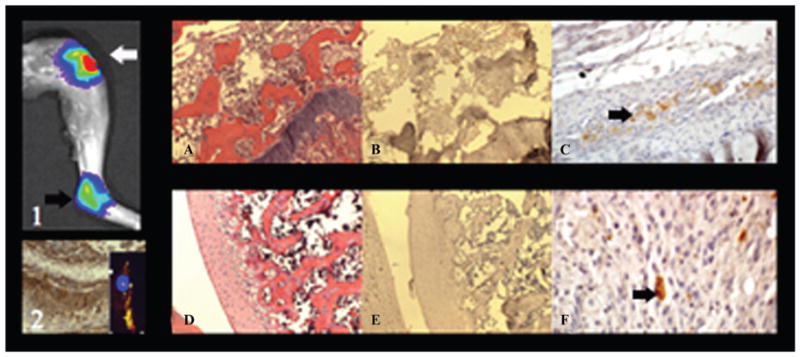
The purpose of this study was to compare viable and nonviable bilabeled mesenchymal stem cells (MSCs) in arthritic joints with magnetic resonance imaging (MRI) and optical imaging (OI). MSCs were labeled with ferucarbotran and DiD. MRI and OI of bilabeled cells were compared with controls. Six rats with arthritis received intra-articular injections of bilabeled viable MSCs into the right knee and nonviable MSCs into the left knee. Animals underwent MRI and OI preinjection and at 4, 24, 48, and 72 hours postinjection. The results were analyzed with a mixed random effects model and Fisher probability. Bilabeled MSCs showed increased MRI and OI signals compared to unlabeled controls (p < .0001). After intra-articular injection, bilabeled MSCs caused significant T2 and T2* effect on MRI and fluorescence on OI up to 72 hours postinjection (p < .05). There was no significant difference between viable and nonviable MSC signal in the knee joints; however, some of the viable cells migrated to an adjacent inflamed ankle joint (p < .05). Immunohistochemistry confirmed viable MSCs in right knee and ankle joints and nonviable MSCs in the left knee. Viable and nonviable cells could not be differentiated with MRI or OI signal intensity but were differentiated based on their ability to migrate in vivo.


Figures

Figure 1
Figure 1
High-power (40×) fluorescent image of a ferucarbotran- and DiD-labeled human mesenchymal stem cell (hMSC). A, The blue channel demonstrates the cell’s nucleus counterstained with DAPI. B, The red channel demonstrates DiD located within the cell membrane. C, The green channel demonstrates ferucarbotran located within the cytoplasm with the antidextran counterstain. D, A fusion image (blue, red, and green channels) of the double-labeled hMSC. Scale: 10 μm.
Figure 2
Figure 2
A, Optical image (OI) representative color scale. B, OI of in vitro bilabeled human mesenchymal stem cells (hMSCs) in increasing cell concentration from left to right: control, 62,500, 125,000, 250,000, 500,000, and 1,000,000. C, OI of intra-articular bilabeled hMSCs in decreasing cell concentration from left to right, as defined by an arrow pointing to each joint: 250,000, 125,000, 62,500, and 31,250. D, T2* magnetic resonance imaging (MRI) of in vitro bilabeled hMSCs in increasing cell concentration from left to right: control, 62,500, 125,000, 250,000, 500,000, and 1,000,000. E, T2* MRI of in vivo bilabeled hMSCs in decreasing cell concentration from left to right, as defined by an arrow pointing to each joint: 250,000, 125,000, 62,500, and 31,250.
Figure 3
Figure 3
Mean signal intensities and standard deviations of increasing cell numbers of bilabeled human mesenchymal cells measured by region of interest with optical imaging (OI) (efficiency) and magnetic resonance imaging (T2* relaxation rate). There was a significant increase in OI signal with increasing cell concentration (p < .05). There was a significant decrease in the T2* relaxation rate with increasing cell concentration (p < .05).
Figure 4
Figure 4
Representative optical images (OI) and magnetic resonance images (MRI) (T2*) scan of the lower extremities of one rat with antigen-induced arthritis that received intra-articular injections of ferucarbotran- and DiD-labeled human mesenchymal stem cells in the right knee and double-labeled cells treated with mitomycin C in the left knee. All time points are included, and an arrow defines relevant joints. OI anterior demonstrates the fluorescent signal of the knees postinjection up to 72 hours, which was not significantly different between the right and the left. OI posterior demonstrates the increased fluorescent signal of the right ankle joint between 24 and 72 hours postinjection, revealing migration of the double-labeled cells. T2* MRI of the knee joints demonstrates a significantly decreased signal at all time points postinjection up to 72 hours, which was not significantly different between the right and left joints.
Figure 5
Figure 5
Representative magnetic resonance images of the T1, T2, and T2* sequences used to image the right and left knee joints in vivo. The decreased T2 and T2* signal of bilabeled cells was visible within the knee joints at all time points postinjection up to 12 days, as defined by arrows. The T2 effect was also apparent on T1-weighted sequences within the knee joints at all time points postinjection up to 12 days, as defined by arrows.
Figure 6
Figure 6
(1) Postmortem optical imaging of the right knee and ankle joint demonstrates a significant fluorescent signal and illustrates the described in vivo migration of viable bilabeled human mesenchymal stem cells (hMSCs). (2) Positive CD44 control sample from the immunohistochemistry kit and inset of a bilabeled hMSC fluorescent microscopy image. A, Hematoxylin-eosin stain of the right knee confirms arthritis with inflammatory cells and a markedly thickened synovium (× 10 original magnification). B, Corresponding CD44 stain confirms CD44-positive hMSCs in the arthritic synovium (× 10 original magnification). C, Corresponding image at a higher magnification (× 40 original magnification) demonstrates, at a single cell level, the CD44-positive hMSCs within the right knee joint, as defined by the arrow. D, Hematoxylin-eosin stain of the right ankle joint confirms arthritis with inflammatory cells (× 10 original magnification). E, Corresponding CD44 stain confirms scattered CD44-positive hMSCs within the right ankle joint (× 10 original magnification). F, Scattered CD44-positive hMSCs, as defined by the arrow (× 60 original magnification).

Similar articles

Cited by

References

    1. van Laar JM, Tyndall A. Adult stem cells in the treatment of autoimmune diseases. Rheumatology (Oxford) 2006;45:1187–93. - PubMed
    1. De Kleer IM, Brinkman DM, Ferster A, et al. Autologous stem cell transplantation for refractory juvenile idiopathic arthritis: analysis of clinical effects, mortality, and transplant related morbidity. Ann Rheum Dis. 2004;63:1318–26. - PMC - PubMed
    1. Djouad F, Fritz V, Apparailly F, et al. Reversal of the immunosuppressive properties of mesenchymal stem cells by tumor necrosis factor alpha in collagen-induced arthritis. Arthritis Rheum. 2005;52:1595–603. - PubMed
    1. Stoop R, Albrecht D, Gaissmaier C, et al. Comparison of marker gene expression in chondrocytes from patients receiving autologous chondrocyte transplantation versus osteoarthritis patients. Arthritis Res Ther. 2007;9:R60. - PMC - PubMed
    1. Kostura L, Kraitchman DL, Mackay AM, et al. Feridex labeling of mesenchymal stem cells inhibits chondrogenesis but not adipogenesis or osteogenesis. NMR Biomed. 2004;17:513–7. - PubMed

Publication types