

Evaluation of [(11)C]MRB for assessment of occupancy of norepinephrine transporters: Studies with atomoxetine in non-human primates
- PMID: 20869448
- PMCID: PMC3710586
- DOI: 10.1016/j.neuroimage.2010.09.040
Evaluation of [(11)C]MRB for assessment of occupancy of norepinephrine transporters: Studies with atomoxetine in non-human primates
Abstract
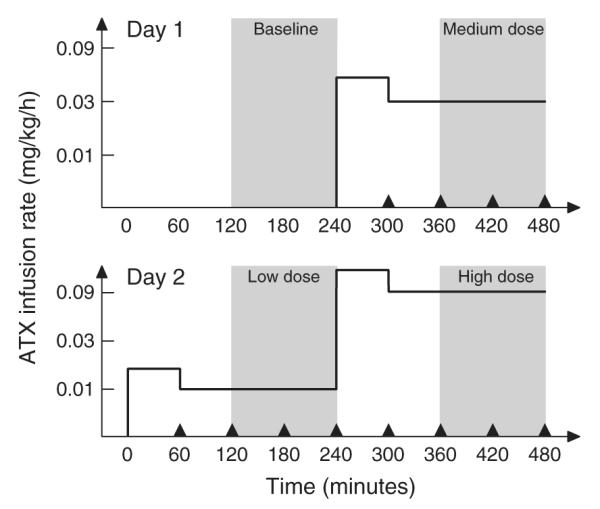
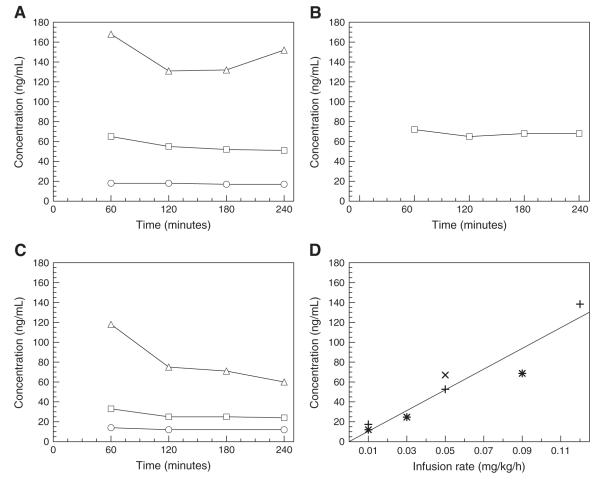
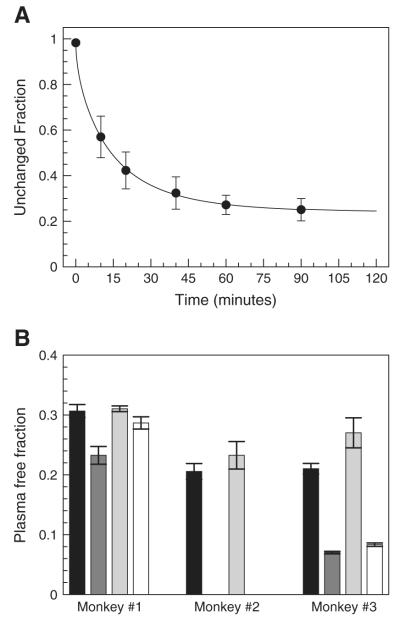
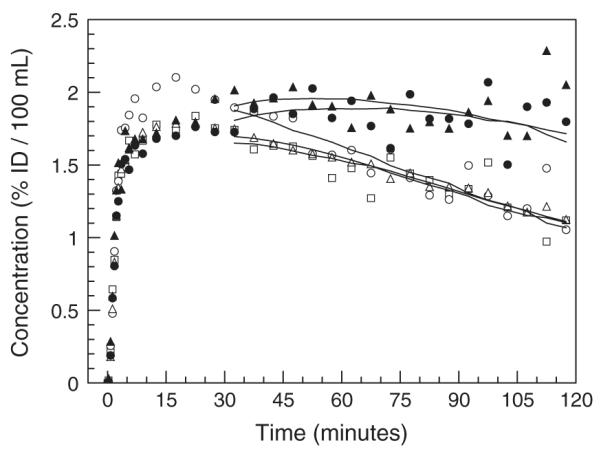
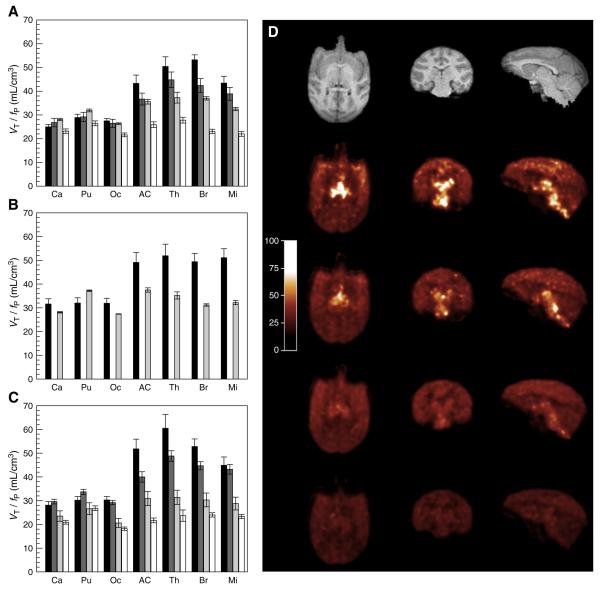
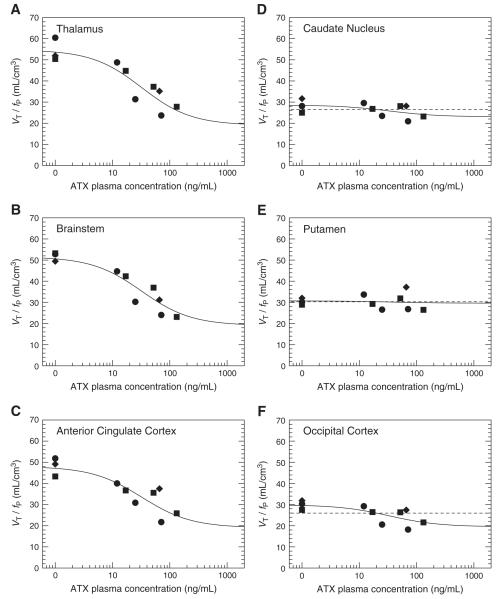
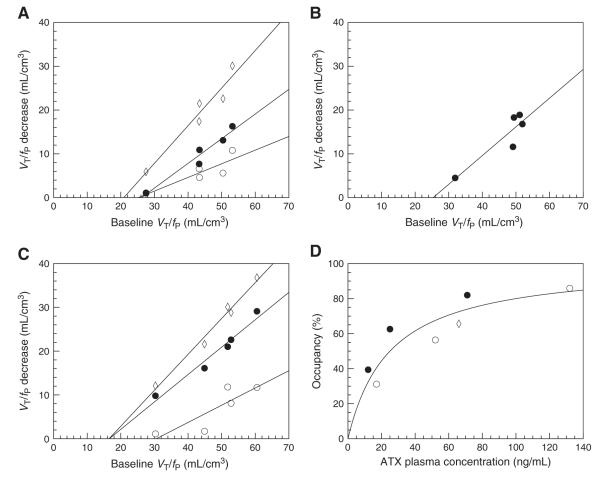
[(11)C]MRB is one of the most promising radioligands used to measure brain norepinephrine transporters (NET) with positron emission tomography (PET). The objective of this study was to evaluate the suitability of [(11)C]MRB for drug occupancy studies of NET using atomoxetine (ATX), a NET uptake inhibitor used in the treatment of depression and attention-deficit hyperactivity disorder (ADHD). A second goal of the study was identification of a suitable reference region. Ten PET studies were performed in three anesthetized rhesus monkeys following an infusion of ATX or placebo. [(11)C]MRB arterial input functions and ATX plasma levels were also measured. A dose-dependent reduction of [(11)C]MRB volume of distribution was observed after correction for [(11)C]MRB plasma free fraction. ATX IC(50) was estimated to be 31 ± 10ng/mL plasma. This corresponds to an effective dose (ED(50)) of 0.13mg/kg, which is much lower than the therapeutic dose of ATX in ADHD (1.0-1.5mg/kg). [(11)C]MRB binding potential BP(ND) in the thalamus was estimated to be 1.8 ± 0.3. Defining a reference region for a NET radiotracer is challenging due to the widespread and relatively uniform distribution of NET in the brain. Three regions were evaluated for use as reference region: caudate, putamen and occipital cortex. Caudate was found to be the most suitable for preclinical drug occupancy studies in rhesus monkeys. The IC(50) estimate obtained using MRTM2 BP(ND) without arterial blood sampling was 21 ± 3ng/mL (using caudate as the reference region). This study demonstrated that [(11)C]MRB is suitable for drug occupancy studies of NET.
Copyright © 2010 Elsevier Inc. All rights reserved.
Figures
Similar articles
-
Clinical doses of atomoxetine significantly occupy both norepinephrine and serotonin transports: Implications on treatment of depression and ADHD.Neuroimage. 2014 Feb 1;86:164-71. doi: 10.1016/j.neuroimage.2013.08.001. Epub 2013 Aug 9. Neuroimage. 2014. PMID: 23933039
-
Imaging the norepinephrine transporter in humans with (S,S)-[11C]O-methyl reboxetine and PET: problems and progress.Nucl Med Biol. 2007 Aug;34(6):667-79. doi: 10.1016/j.nucmedbio.2007.03.013. Epub 2007 Jun 8. Nucl Med Biol. 2007. PMID: 17707807 Clinical Trial.
-
Saturated norepinephrine transporter occupancy by atomoxetine relevant to clinical doses: a rhesus monkey study with (S,S)-[(18)F]FMeNER-D (2).Eur J Nucl Med Mol Imaging. 2009 Aug;36(8):1308-14. doi: 10.1007/s00259-009-1118-9. Epub 2009 Mar 20. Eur J Nucl Med Mol Imaging. 2009. PMID: 19300997
-
PET imaging of norepinephrine transporters.Curr Pharm Des. 2006;12(30):3831-45. doi: 10.2174/138161206778559687. Curr Pharm Des. 2006. PMID: 17073682 Review.
-
Atomoxetine: a review of its use in attention-deficit hyperactivity disorder in children and adolescents.Paediatr Drugs. 2009;11(3):203-26. doi: 10.2165/00148581-200911030-00005. Paediatr Drugs. 2009. PMID: 19445548 Review.
Cited by
-
Characterization of Amphetamine, Methylphenidate, Nicotine, and Atomoxetine on Measures of Attention, Impulsive Action, and Motivation in the Rat: Implications for Translational Research.Front Pharmacol. 2020 Apr 24;11:427. doi: 10.3389/fphar.2020.00427. eCollection 2020. Front Pharmacol. 2020. PMID: 32390829 Free PMC article.
-
Single-dose effects of methylphenidate and atomoxetine on functional connectivity during an n-back task in boys with ADHD.Psychopharmacology (Berl). 2023 Oct;240(10):2045-2060. doi: 10.1007/s00213-023-06422-7. Epub 2023 Jul 27. Psychopharmacology (Berl). 2023. PMID: 37500785 Free PMC article. Clinical Trial.
-
PET imaging evaluation of [(18)F]DBT-10, a novel radioligand specific to α7 nicotinic acetylcholine receptors, in nonhuman primates.Eur J Nucl Med Mol Imaging. 2016 Mar;43(3):537-47. doi: 10.1007/s00259-015-3209-0. Epub 2015 Oct 12. Eur J Nucl Med Mol Imaging. 2016. PMID: 26455500 Free PMC article.
-
Imaging human brown adipose tissue under room temperature conditions with (11)C-MRB, a selective norepinephrine transporter PET ligand.Metabolism. 2015 Jun;64(6):747-55. doi: 10.1016/j.metabol.2015.03.001. Epub 2015 Mar 5. Metabolism. 2015. PMID: 25798999 Free PMC article.
-
Changes of central noradrenaline transporter availability in immunotherapy-naïve multiple sclerosis patients.Sci Rep. 2020 Sep 4;10(1):14651. doi: 10.1038/s41598-020-70732-5. Sci Rep. 2020. PMID: 32887904 Free PMC article.
References
-
- Arakawa R, Okumura M, Ito H, Seki C, Takahashi H, Takano H, Nakao R, Suzuki K, Okubo Y, Halldin C, Suhara T. Quantitative analysis of norepinephrine transporter in the human brain using PET with (S, S)-18F-FMeNER-D2. J. Nucl. Med. 2008;49:1270–1276. - PubMed
-
- Barker EL, Blakely RD. Norepinephrine and serotonin transporters: molecular targets of antidepressant drugs. In: Bloom FE, Kupfer DJ, editors. Psychopharmacology: the fourth generation of progress. Raven Press; New York, NY: 1995. pp. 321–334.
-
- Beck J, Arnold K. Parameter estimation in engineering and science. Wiley; New York, NY: 1977.
-
- Bymaster FP, Katner JS, Nelson DL, Hemrick-Luecke SK, Threlkeld PG, Heiligenstein JH, Morin SM, Gehlert DR, Perry KW. Atomoxetine increases extracellular levels of norepinephrine and dopamine in prefrontal cortex of rat: A potential mechanism for efficacy in attention deficit/hyperactivity disorder. Neuropsychopharmacology. 2002;27:699–711. - PubMed
-
- Carson RE, Barker WC, Liow J, Johnson CA. Design of a motion-compensation OSEM list-mode algorithm for resolution-recovery reconstruction for the HRRT. IEEE Nucl. Sci. Symp. Conf. Rec. 2003;5:3281–3285.
Publication types
MeSH terms
Substances
Grants and funding
LinkOut - more resources
Full Text Sources
