. 2010 Sep 23;67(6):997-1008.
doi: 10.1016/j.neuron.2010.08.024.

Arrestin translocation is stoichiometric to rhodopsin isomerization and accelerated by phototransduction in Drosophila photoreceptors

Affiliations

Arrestin translocation is stoichiometric to rhodopsin isomerization and accelerated by phototransduction in Drosophila photoreceptors

Akiko K Satoh et al. Neuron. .

Abstract

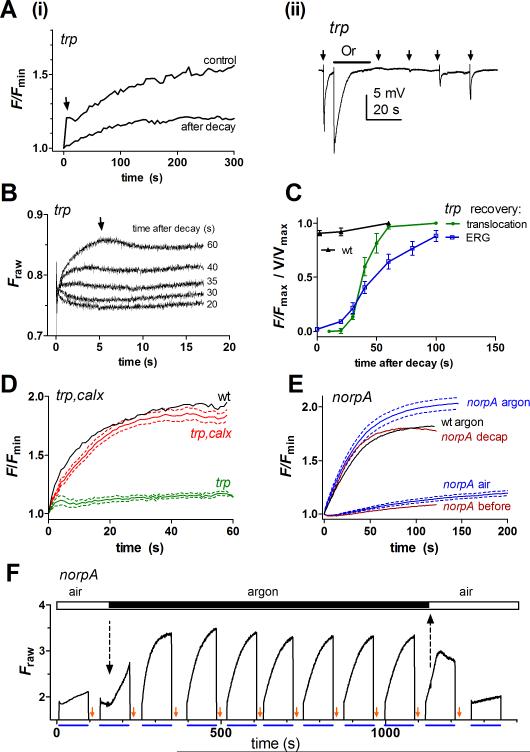
Upon illumination, visual arrestin translocates from photoreceptor cell bodies to rhodopsin and membrane-rich photosensory compartments, vertebrate outer segments or invertebrate rhabdomeres, where it quenches activated rhodopsin. Both the mechanism and function of arrestin translocation are unresolved and controversial. In dark-adapted photoreceptors of the fruitfly Drosophila, confocal immunocytochemistry shows arrestin (Arr2) associated with distributed photoreceptor endomembranes. Immunocytochemistry and live imaging of GFP-tagged Arr2 demonstrate rapid reversible translocation to stimulated rhabdomeres in stoichiometric proportion to rhodopsin photoisomerization. Translocation is very rapid in normal photoreceptors (time constant <10 s) and can also be resolved in the time course of electroretinogram recordings. Genetic elimination of key phototransduction proteins, including phospholipase C (PLC), Gq, and the light-sensitive Ca2+-permeable TRP channels, slows translocation by 10- to 100-fold. Our results indicate that Arr2 translocation in Drosophila photoreceptors is driven by diffusion, but profoundly accelerated by phototransduction and Ca2+ influx.


Figures

Figure 1
Figure 1. Light concentrates Arr2 in rhabdomeres
(A) Left: Arr2 in control (dark-reared) ommatidium immunolocalizes to both cell body and rhabdomeres (r). Also indicated: rhabdomere terminal web (rtw); nucleus (n); inter-rhabdomere space (irs). Pigment cells surrounding ommatidia lack Arr2. In eyes dissected after 10 min exposure to 470 nm (blue) light, cytoplasmic Arr2 has translocated to rhabdomeres. Translocation was completely reversed by orange (560 nm) exposure following blue light (blue->orange). Orange light did not redistribute Arr2 (n = 2-4 flies). (B) Arr2 in ommatidia of dark-reared wild-type (w1118) flies colocalized with the endomembrane marker HDEL (n = 4 flies). Arr2 and HDEL immunopositive crescents highlight the SRC. Bright rings of HDEL immunofluorescence between ommatidia highlight perinuclear ER of pigment cells, which do not express Arr2. Merged image (right) shows extensive colocalization (yellow). (C) In dark-adapted photoreceptors, Arr2 did not colocalize with microtubules (MT) stained with anti-tubulin; MT are largely excluded from cytoplasm. Projection image from 5 pictures taken at 0.5 μm intervals (n = 2 flies). Scale bar: 2 μm.
Figure 2
Figure 2. In vivo imaging of Arr2-GFP translocation
(A) Frames at indicated times from a time-lapse movie (100 ms exposure, 1 s-1) of DPP fluorescence in transgenic flies expressing Arr2-GFP in outer photoreceptors, R1-R6 (see Movie S1). Non-expressing R7 forms the dark ‘keyhole’ at the DPP center. The first DPP image (t = 0 s) in orange- and then dark-adapted (10 min) eyes shows weak fluorescence, brightening rapidly in response to blue imaging flashes. (B) Using the DPP as region of interest, average pixel intensity, F (background subtracted, raw signal, arbitrary units), increased rapidly ca 2.5 fold, data fitted with single exponential function, time constant 12.5 s. (C) Averaged time course, normalized (Fnorm) between Fmax and Fmin (i.e F at time = 60s and 0 s) from similar measurements from flies dark adapted for 10 min (right curve, mean ± SEM, n = 19 flies) or 1 minute (left curve, n = 23), data fitted with single exponentials with time constants 6.8 and 11.3 s respectively. (D) Continuous recording of normalized DPP fluorescence sampled at 500 Hz by a photomultiplier after 1 minute dark adaptation. Inset on expanded timebase; transient (arrow) reflects R>M photoisomerization. (E) Two flash experiment to determine time course of reverse translocation. Starting with Arr2-GFP fully translocated following blue excitation (B), a brief (500 ms) ultrabright orange (Or) LED stimulus photoreconverted M to R; Arr2-GFP fluorescence was measured (by PMT) after varying delays (8, 6, 4, 3, 2 s). For trace marked “0” there was no reconverting Or stimulus. (F) Averaged data from traces as in E (mean ± SEM n = 8): fluorescence returned rapidly to the dark-adapted state, fitted by a single exponential with time constant 2.4 s. Data in A-C obtained using w1118; Rh1Gal4, UAS-Arr-2GFP,arr23/TM3 heterozygotes; D-F using w1118; Rh1-Arr2-GFP/CyO.
Figure 3
Figure 3. Spectral dependence of Arr2 translocation
(A) Spectral properties of the Rh1 pigment system; normalized photosensitivities of rhodopsin (R, λmax = 480 nm) and metarhodopsin (M, λmax = 570 nm) are plotted using nomograms (Govardovskii et al., 2000). The photoequilibrium function fM(λ), derived by dividing the R photosensitivity spectrum by the M spectrum (magenta), closely fits available data (magenta symbols, our own data, mean, n = 3; closed symbols from Minke and Kirschfeld, 1979; open symbols, Belusic et al., 2010) . (B) Normalized fluorescence Fnorm = (F-Fmin)/(Fmax-Fmin) 50 ms after onset of blue test flash as a function of wavelength of prior photoequilibrating stimulus. Black plot: “control” data from flies expressing one copy of Rh1-Arr2-GFP (mean ± SEM, n = 12). Inset shows representative traces measured 10 s after termination of 20 s photoequilibrating stimuli of different wavelengths. Green plot, data from Rh1-Arr2GFP; ninaE/+ heterozygotes containing only ~60% Rh1 (n = 5). Blue symbols, dotted line: normalized fraction of endogenous Arr2 immunofluorescence in rhabdomere in wild type (w1118) measured from images as in C (mean ± SEM of 12 ommatidia from 4 flies at each wavelength). (C) Confocal images of Arr2 immunofluorescence in wildtype (w1118) eyes dark-dissected immediately following illumination at indicated wavelengths. Localization after 560 nm light was indistinguishable from dark-reared flies (c.f. Figure 1), but the fraction of Arr2 in rhabdomeres increased with shorter wavelengths. Scale bar: 5 μm. (D) Control and ninaE/+ heterozygote data from panel (B) replotted as a function of fM transformed using the fM(λ) function from panel A. (E) Control data set from D replotted in terms of number of Arr2 and M molecules per microvillus, assuming there are 2.7 × more Rh1 molecules than available Arr2 molecules in the cell, and that 25% of Arr2 is in the rhabdomere in the dark (first responder pool). The straight line represents 1:1 stoichiometry.
Figure 4
Figure 4. Electrophysiological correlates of Arr2 translocation
(A) Electroretinogram (ERG) responses to 2 s photoequilibrating stimuli of different wavelengths in white-eyed flies (w1118). M was fully photoreconverted to R one minute before each stimulus by an ultrabright orange LED. At 520 nm there was a PDA that failed to recover. Between ca. 535 and 525 nm the recovery time courses became progressively longer. (B, C) Averaged data (mean ± SEM n = 7) plotted against wavelength (B) and fM (C): PDA, normalized to maximal PDA (at λ <515 nm) measured 40 s after the stimulus; t½ is the time to 50% recovery of the ERG. The normalized extent of translocation measured from Arr2-GFP fluorescence is replotted from Figure 3. (D) Responses to 2 s photoequilibrating 530 nm flashes expected to induce ~50% translocation (see panel B). 1st flashes, delivered 1 min after long wavelength illumination had fully reconverted M to R, showed a slow recovery phase as in panel A (2 example traces superimposed); responses to subsequent identical “2nd” flashes without an intervening reconverting stimulus (green) showed accelerated decay, similar to responses to 550 nm light (orange trace) that induced negligible translocation. Inset: bargraph showing time to 50% decay (t½: mean ± SEM, n = 9). (E) Responses to brief (4 ms) 560 nm flashes which by themselves caused negligible (<1%) R>M or M>R conversion, before (DA) or after (530 Ad, green) translocation induced by photoequilibrating 530 nm illumination. Bar graph, showing t½ for decay, indicates that translocation induced no significant difference in response kinetics under these conditions (mean ± SEM n= 4).
Figure 5
Figure 5. Arr2 translocation is slowed in transduction mutants
(A) Translocation timecourses determined by imaging DPP fluorescence of norpAP24, trp301 and ninaCP235 mutants expressing Arr2-GFP; data normalized to Fmin (i.e. F at time zero). Both speed and relative increase were greatly reduced in norpA and trp. In ninaCP235 the time course was similar to wild-type, but the overall increase enhanced. Traces averaged from measurements in 4 (norpA), 9 (trp, ninaC) and 19 (wild-type) flies dark-adapted for 10 min after orange pre-illumination. norpA data fitted by sum of two exponentials (t1 = 91 s, t2= 1107 s). (B) Arr2-GFP fluorescence now fully normalized between Fmin and Fmax (or F at 300 s in norpA and trp) to compare time courses on a faster time scale. The time course in ninaC was similar to that in wild-type flies (data from panel A), but much slower in norpA (averaged from n = 5 further flies recorded on faster time base). In trp (n = 9) translocation was initially as fast as in wt but after ~5 s slowed dramatically. (C) Left, overall fluorescence increase (Fmax/Fmin) after 60 s (wt and ninaC) and after 3 minutes (1) and 30 min (2) for norpA and 5 min for trp; right, time constant of exponentials fitted to data (wt and ninaC fitted with one exponential, norpA with two time constants; trp with one time constant, ignoring the first 5 seconds). * p < 0.01; ** p< 10-5 2-tailed t-test with respect to wt. (D) Arr2 immunostaining from wild-type and norpA retinae dark-dissected following 2 min blue light illumination, and after 2 min blue light followed by 1 hr in dark. In norpA, cytoplasmic Arr2 persisted abnormally at 2 min, but was rhabdomeric by 1 hr. Scale bar: 5 ±m. (E) Fraction of total Arr2 immunofluorescence in the rhabdomere (frhab), in flies fixed in the dark or after blue illumination. Compared to wild-type all mutants except ninaC showed significantly less Arr2 in the rhabdomere 3 min after blue light. Levels in trpl;trp and norpA were also significantly lower than in dgq or trp. Any differences in dark-adapted values amongst the various mutants did not reach statistical significance. Wild-type and norpA data are also shown from flies fixed 2 min after blue illumination. Mean ± SEM, n = 4-8 flies for each genotype, analysed using ImageJ (* p < 0.05; ** p< 0.0005 ).
Figure 6
Figure 6. Ca2+ influx mediates acceleration of translocation
(A) (i) translocation in a trp mutant (monitored by imaging Arr2-GFP) measured after 1 min (control), or only 15 s in the dark after “trp decay” induced by 20 s orange illumination. The initial fast phase (arrow) was absent in measurements made 15 s after decay. (ii) ERG recording from trp mutant; 20 s orange illumination (Or) induced a full “trp” decay and rendered the eye temporarily refractory to brief (100 ms) test flashes (arrows). (B) Translocation on a faster timescale (PMT measurements of Arr2-GFP fluorescence) in a trp mutant measured after varying times in dark following “trp decay” induced by 20 s orange LED. The fast phase of translocation (arrow) began to recover after >30 s in the dark. (C) Normalized time-course of recovery of fast phase translocation in trp mutants measured from the level of Arr-2GFP fluorescence 10s after onset of blue light (green plot, from traces as in B, mean ± SEM n = 5). Blue plot: time course of recovery of the response to test flashes in the ERG (n = 5). In otherwise wild-type flies (black, n = 4), at least 90% full, rapid translocation was observed immediately (ca 1.5 s) after the orange light was turned off. (D) Translocation measured from imaging Arr2-GFP fluorescence in calxA, trp343 double mutants (red, mean ± SEM, n = 6 flies) was similar to wild-type (black) and clearly rescued compared to trp343 mutants (green, n = 4 flies). (E) Averaged translocation time courses in norpA mutants (blue; mean ± SEM, n = 5; PMT measurements), measured in air and argon from the same flies. Red traces: norpA mutant (in air) before and after (decap) severing the neck (representative, n = 6). Black trace: Arr2-GFP translocation measured in wild-type fly in argon (n = 2). (F) Continuous (PMT) recording of Arr2-GFP fluorescence in norpA. Following each 90 s exposure to blue excitation, M was reisomerized to R by a photoequilibrating orange flash (small arrows). The second run started in air, but after ~10 s, argon was streamed over the fly. Within seconds an increase in fluorescence indicates acceleration of translocation (dotted arrow). Subsequently robust, rapid and reversible translocation was observed for at least 15 min under continuous anoxia. On return to air (upward dotted arrow), translocation stalled, and again only very slow, partial translocation was observed.
Figure 7
Figure 7. A regulated two-sink model for Drosophila Arr2 translocation
Left: Dark-adapted rhabdomeres and adjacent stalk membrane contain R (blue). Cytoplasmic Arr2 (green) associates with ER/endomembrane, a distributed, low affinity 'dark sink'. ~25% of total Arr2 (“first responder” pool) also localizes to the rhabdomere, presumably due to a similar low affinity sink in the microvilli, e.g. binding to phosphoinositides (Lee et al., 2003) or NINAC (Liu et al., 2008). Middle: when the fraction of M (fM) lies between ca. 0.1 and 0.35 (M<Arr2), high affinity, photoactivated M (red) has bound all first responder Arr2 and recruited additional Arr2 from photoreceptor cytoplasm, initiating translocation and quenching signalling. Increased cytosolic Ca2+ downstream of phototransduction is hypothesized to promote Arr2 endomembrane dissociation, facilitating its diffusive search for high affinity M. Right: Stimuli generating M in excess of Arr2 (fM> 0.35) result in binding and translocation of virtually all Arr2, but still leave unquenched M, generating a PDA.

Similar articles

Cited by

References

    1. Agam K, von Campenhausen M, Levy S, Ben-Ami HC, Cook B, Kirschfeld K, Minke B. Metabolic stress reversibly activates the Drosophila light- sensitive channels TRP and TRPL in vivo. J. Neurosci. 2000;20:5748–5755. - PMC - PubMed
    1. Alloway PG, Howard L, Dolph PJ. The formation of stable rhodopsinarrestin complexes induces apoptosis and photoreceptor cell degeneration. Neuron. 2000;28:129–138. - PubMed
    1. Arikawa K, Matsushita A. Immunogold localization of opsin and actin in Drosophila photoreceptors that undergo active rhabdomere morphogenesis. Zool. Soc. Japan. 1994;11:391–398.
    1. Belusic G, Pirih P, Stavenga DG. Photoreceptor responses of fruitflies with normal and reduced arrestin content studied by simultaneous measurements of visual pigment fluorescence and ERG. J. Comp. Physiol. A. 2010;196:23–35. - PMC - PubMed
    1. Broekhuyse RM, Tolhuizen EF, Janssen AP, Winkens HJ. Light induced shift and binding of S-antigen in retinal rods. Curr. Eye Res. 1985;4:613–618. - PubMed

Publication types

MeSH terms

LinkOut - more resources