. 2011 Jan;175(1):39-48.
doi: 10.1016/j.molbiopara.2010.08.008. Epub 2010 Sep 24.

Remodeling of protein and mRNA expression in Leishmania mexicana induced by deletion of glucose transporter genes

Affiliations

Remodeling of protein and mRNA expression in Leishmania mexicana induced by deletion of glucose transporter genes

Xiuhong Feng et al. Mol Biochem Parasitol. 2011 Jan.

Abstract

Glucose is a major nutrient in the insect vector stage of Leishmania parasites. Glucose transporter null mutants of Leishmania mexicana exhibit profound phenotypic changes in both insect stage promastigotes and mammalian host stage amastigotes that reside within phagolysosomes of host macrophages. Some of these phenotypic changes could be either mediated or attenuated by changes in gene expression that accompany deletion of the glucose transporter genes. To search for changes in protein expression, the profile of proteins detected on two-dimensional gels was compared for wild type and glucose transporter null mutant promastigotes. A total of 50 spots whose intensities changed significantly and consistently in multiple experiments were detected, suggesting that a cohort of proteins is altered in expression levels in the null mutant parasites. Following identification of proteins by mass spectrometry, 3 such regulated proteins were chosen for more detailed analysis: mitochondrial aldehyde dehydrogenase, ribokinase, and hexokinase. Immunoblots employing antisera against these enzymes confirmed that their levels were upregulated, both in glucose transporter null mutants and in wild type parasites starved for glucose. Quantitative reverse transcriptase PCR (qRT-PCR) revealed that the levels of mRNAs encoding these enzymes were also enhanced. Global expression profiling using microarrays revealed a limited number of additional changes, although the sensitivity of the microarrays to detect modest changes in amplitude was less than that of two-dimensional gels. Hence, there is likely to be a network of proteins whose expression levels are altered by genetic ablation of glucose transporters, and much of this regulation may be reflected by changes in the levels of the cognate mRNAs. Some of these changes in protein expression may reflect an adaptive response of the parasites to limitation of glucose.


Figures

Fig. 1
Fig. 1
Two-dimensional gels from lysates of wild type (green) and Δlmgt glucose transporter null mutants (magenta). A. Lysates were separated on non-linear isoelectric focusing gels in the first dimension and gradient SDS-polyacrylamide gels in the second dimension. Numbers at the left indicate the positions of protein molecular weight standards, designated in kDa; numbers at the bottom indicate the pH of the first dimension. The figure represents a composite electronic image of the 8 gels of wild type lysates and 8 gels of Δlmgt glucose transporter null mutant lysates that were silver stained. B. Three regions of the gels, indicated by boxes I–III in part A, are presented as topographic images, where peak heights represent staining intensities. Images from the Δlmgt glucose transporter null mutant are shown at the left and wild type images are at the right. Blue outlines around peaks represent individual spots, as determined by Phoretix 2D software, and the numbers in green indicate peaks of interest within each box whose height differed significantly between Δlmgt and wild type parasites. The following proteins were identified by mass spectrometry in each spot: Box I: spot 1 – mALDH; Box II: spot 1 – D-LDH and RK, spot 2 – RK, spot 4 – mALDH; Box III: spot 1, nucleoside diphosphate kinase, spot 2 – mALDH, spot 3 – cyclophilin.
Fig. 2
Fig. 2
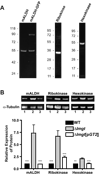
Quantification of expression of mALDH, ribokinase, and hexokinase in wild type and Δlmgt null mutants with monospecific antibodies. A. Characterization of antisera by immunoblotting. The mALDH antibody (left panel) was used to probe an immunoblot of lysates from wild type parasites (mALDH) and lysates from parasites expressing a mALDH-GFP fusion protein from an episomal expression vector. Ribokinase (middle) and hexokinase (right) antibodies were employed to probe blots of lysates from Δlmgt parasites. B. Relative expression levels of mALDH, ribokinase, and hexokinase were quantified in 1, wild type (WT); 2, Δlmgt null mutants; and 3, Δlmgt[pGT2] complemented null mutants by immunoblot analysis. Blots (top) were probed with each of the 3 antibodies and with anti-α-tubulin antibody as a normalization control, and the normalized values were plotted (bottom) setting the relative level of expression in wild type parasites to 1.0. Values represent the mean and standard deviation of n independent measurements (mALDH, n = 4; ribokinase, n = 8; hexokinase, n = 6). The statistical significance of the difference in protein expression compared to the Δlmgt null mutant was determined using Student’s t-test (**, p < 0.01; ***, p < 0.001).
Fig. 3
Fig. 3
Quantification of induction of mALDH (A), ribokinase (B), and hexokinase (C) in wild type parasites cultured in glucose-replete (11 mM glucose, 10% FBS) or glucose-limited (no added glucose, 10% FBS) RPMI medium. Immunoblots were probed with each antibody and with anti-α-tubulin antibody, the signals were normalized to that of α-tubulin, and the relative levels were plotted. The amount of each protein present at day 0 was set to a value of 1.0. Data represent mean and standard deviation of n independent measurements (mALDH, n = 4; ribokinase, n = 4; hexokinase, n = 3).
Fig. 4
Fig. 4
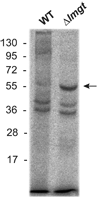
Relative rates of synthesis of mALDH were determined in wild type (WT) and Δlmgt null mutants by pulse labeling followed by immunoprecipitation. mALDH is the band at ~55 kDa (arrow), and the doublet between ~36–40 kDa represents non-specifically precipitated proteins that serve as controls for synthesis and loading. Numbers at the left represent protein molecular weight markers in kDa.
Fig. 5
Fig. 5
Immunoblots of two-dimensional gels probed with anti-ribokinase antibody. Lysates were prepared from wild type, Δlmgt, and Δlmgt[pGT2] parasites (indicated at the right). The position of a 35 kDa molecular weight marker is indicated at the left, and the approximate pH of the isoelectric focusing dimension is indicated by the numbers at the top. These results were reproduced in 3 independent experiments.

References

    1. do Vale VF, Pereira MH, Gontijo NF. Midgut pH profile and protein digestion in the larvae of Lutzomyia longipalpis. J Insect Physiol. 2007;53:1151–1159. - PubMed
    1. Schlein Y. Sandfly diet and Leishmania. Parasitol. Today. 1986;2:175–177. - PubMed
    1. Antoine JC, Prina E, Jouanne C, Bongrand P. Parasitophorous vacuoles of Leishmania amazonensis-infected macrophages maintain an acidic pH. Infect Immun. 1990;58:779–787. - PMC - PubMed
    1. McConville MJ, de Souza D, Saunders E, Likic VA, Naderer T. Living in a phagolysosome; metabolism of Leishmania amastigotes. Trends Parasitol. 2007;23:368–375. - PubMed
    1. Burchmore RJS, Rodriguez-Contreras D, McBride K, Merkel P, Barrett MP, Modi G, Sacks DL, Landfear SM. Genetic characterization of glucose transporter function in Leishmania mexicana. Proc. Natl. Acad. Sci. U S A. 2003;100:3901–3906. - PMC - PubMed

Publication types

MeSH terms

LinkOut - more resources