Randomized Controlled Trial
. 2010 Oct;81(10):1105-11.
doi: 10.1136/jnnp.2009.202556.

Transcranial direct current stimulation for the treatment of Parkinson's disease

Affiliations
Randomized Controlled Trial

Transcranial direct current stimulation for the treatment of Parkinson's disease

David H Benninger et al. J Neurol Neurosurg Psychiatry. 2010 Oct.

Erratum in

  • J Neurol Neurosurg Psychiatry. 2011 Mar;82(3):354

Abstract

Background: Progression of Parkinson's disease (PD) is characterised by motor deficits which eventually respond less to dopaminergic therapy and thus pose a therapeutic challenge. Deep brain stimulation has proven efficacy but carries risks and is not possible in all patients. Non-invasive brain stimulation has shown promising results and may provide a therapeutic alternative.

Objective: To investigate the efficacy of transcranial direct current stimulation (tDCS) in the treatment of PD.

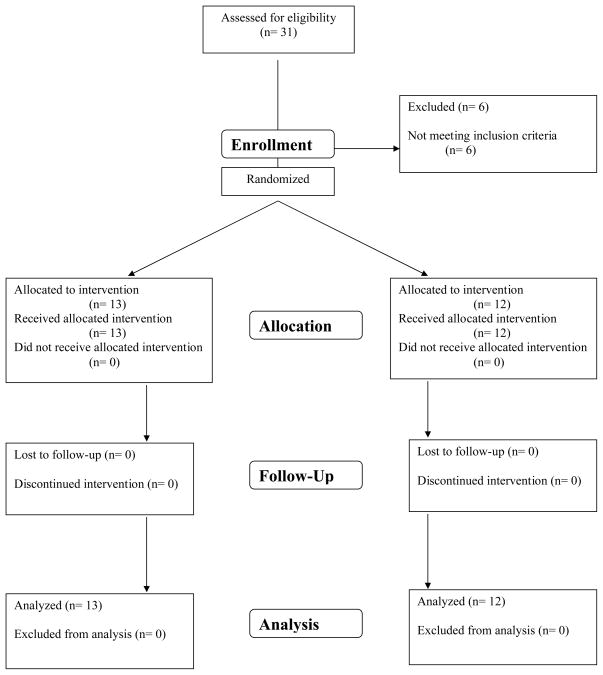
Design: Randomised, double blind, sham controlled study.

Setting: Research institution.

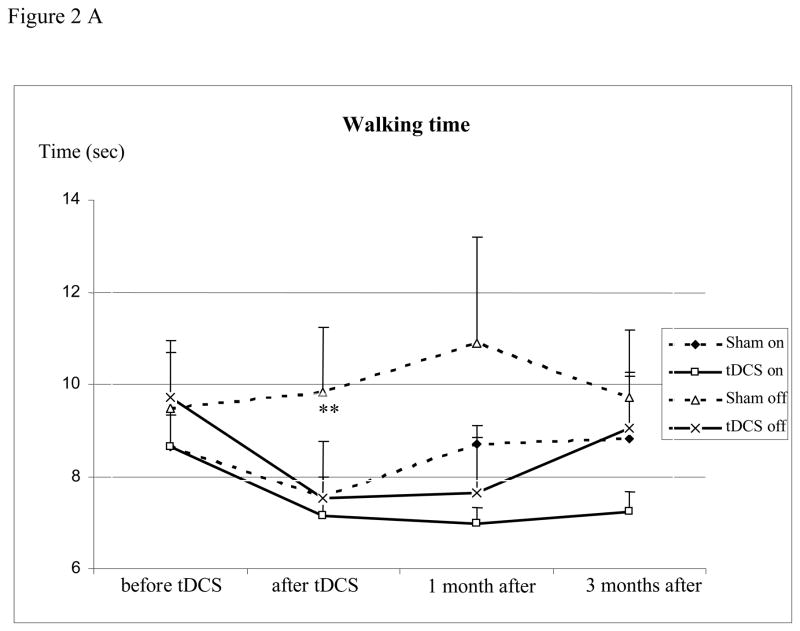
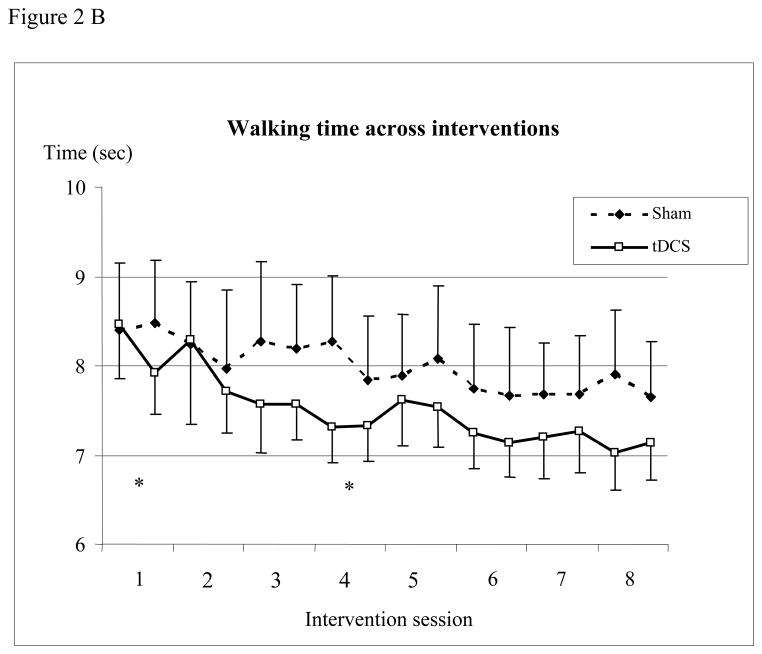
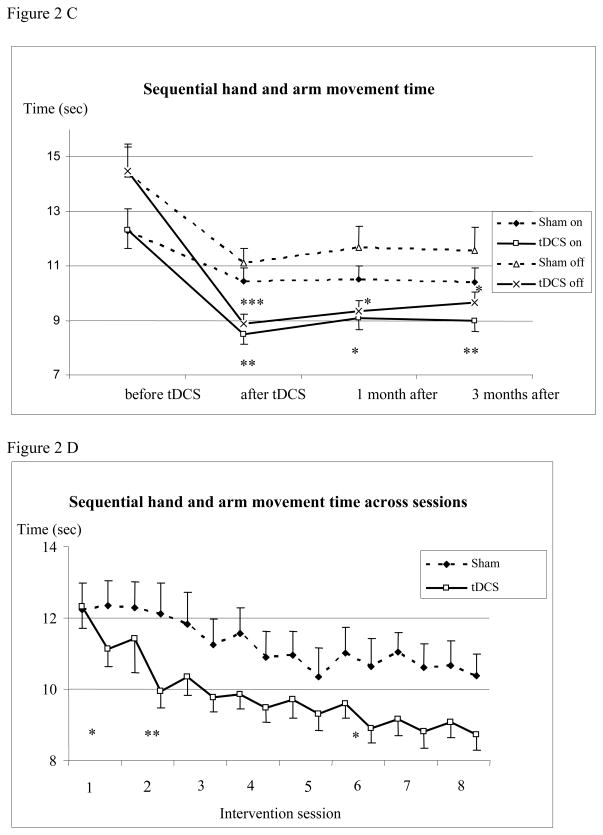
Methods: The efficacy of anodal tDCS applied to the motor and prefrontal cortices was investigated in eight sessions over 2.5 weeks. Assessment over a 3 month period included timed tests of gait (primary outcome measure) and bradykinesia in the upper extremities, Unified Parkinson's Disease Rating Scale (UPDRS), Serial Reaction Time Task, Beck Depression Inventory, Health Survey and self-assessment of mobility.

Results: Twenty-five PD patients were investigated, 13 receiving tDCS and 12 sham stimulation. tDCS improved gait by some measures for a short time and improved bradykinesia in both the on and off states for longer than 3 months. Changes in UPDRS, reaction time, physical and mental well being, and self-assessed mobility did not differ between the tDCS and sham interventions.

Conclusion: tDCS of the motor and prefrontal cortices may have therapeutic potential in PD but better stimulation parameters need to be established to make the technique clinically viable. This study was publicly registered (clinicaltrials.org: NCT00082342).


Figures

Figure 1
Figure 1
Flow diagram of patients with Parkinson’s disease (PD) enrolled in this therapeutic study.
Figure 2
Figure 2
(A) Walking time before, 1 day, and at 1 and 3 months after the intervention (mean ± standard error). The figure shows the decrease in time needed to walk 10 meters in the “on” and “off” condition. Abscissa indicates the time of measurement. Ordinate indicates the walking time. The solid lines indicate the tDCS (n=13) and the dashed lines the sham group (n=11, patient with outliers excluded). Triangles and crosses indicate the “off” (medication) condition and diamonds and squares indicate the “on” condition measurements. (B) Walking time before and after each intervention (mean ± standard error). The figure shows the time needed to walk 10 meters. Abscissa indicates the time of measurement; ordinate indicates the walking time. The solid lines indicate the tDCS (n=13) and the dashed lines the sham group (n=12). Walking time decreased with tDCS compared to sham intervention when looking at the sessions (Treatment x Time interaction, p = 0.0007) being significant at the first session (p = 0.014), while the opposite was found in session 4 (p = 0.011). (* p <0.05; ** p <0.01) Figure 2(C) Sequential hand and arm movement test before, 1 day, at 1 and 3 months after the intervention (mean ± standard error). The figure shows the decrease of time needed to execute the sequential hand and arm movement test in the “on” and “off” conditions which persist for 3 months after tDCS. Measurements for the left and right hands were pooled. Abscissa indicates the time of measurement. Ordinate indicates the execution time. The solid lines indicate tDCS (n=13) and the dashed lines sham group (n=12). Triangles and crosses indicate the “off” (medication) condition and diamonds and squares indicate the “on” condition measurements. (D) Sequential hand and arm movement test before and after each intervention (mean ± standard error). The figure shows the time needed to execute the sequential hand and arm movement test. Measurements for the left and right hands were pooled. Abscissa indicates the time of measurement; ordinate indicates the execution time. The solid lines indicate tDCS and the dashed lines sham group. Sequential hand and arm movement time decreased with tDCS compared to sham intervention when looking at the sessions (Treatment x Time interaction, p = 0.015) being significant after the first two and sixth session (p = 0.035, 0.005 and 0.034). (* p <0.05; ** p <0.01;*** p <0.0001)
Figure 2
Figure 2
(A) Walking time before, 1 day, and at 1 and 3 months after the intervention (mean ± standard error). The figure shows the decrease in time needed to walk 10 meters in the “on” and “off” condition. Abscissa indicates the time of measurement. Ordinate indicates the walking time. The solid lines indicate the tDCS (n=13) and the dashed lines the sham group (n=11, patient with outliers excluded). Triangles and crosses indicate the “off” (medication) condition and diamonds and squares indicate the “on” condition measurements. (B) Walking time before and after each intervention (mean ± standard error). The figure shows the time needed to walk 10 meters. Abscissa indicates the time of measurement; ordinate indicates the walking time. The solid lines indicate the tDCS (n=13) and the dashed lines the sham group (n=12). Walking time decreased with tDCS compared to sham intervention when looking at the sessions (Treatment x Time interaction, p = 0.0007) being significant at the first session (p = 0.014), while the opposite was found in session 4 (p = 0.011). (* p <0.05; ** p <0.01) Figure 2(C) Sequential hand and arm movement test before, 1 day, at 1 and 3 months after the intervention (mean ± standard error). The figure shows the decrease of time needed to execute the sequential hand and arm movement test in the “on” and “off” conditions which persist for 3 months after tDCS. Measurements for the left and right hands were pooled. Abscissa indicates the time of measurement. Ordinate indicates the execution time. The solid lines indicate tDCS (n=13) and the dashed lines sham group (n=12). Triangles and crosses indicate the “off” (medication) condition and diamonds and squares indicate the “on” condition measurements. (D) Sequential hand and arm movement test before and after each intervention (mean ± standard error). The figure shows the time needed to execute the sequential hand and arm movement test. Measurements for the left and right hands were pooled. Abscissa indicates the time of measurement; ordinate indicates the execution time. The solid lines indicate tDCS and the dashed lines sham group. Sequential hand and arm movement time decreased with tDCS compared to sham intervention when looking at the sessions (Treatment x Time interaction, p = 0.015) being significant after the first two and sixth session (p = 0.035, 0.005 and 0.034). (* p <0.05; ** p <0.01;*** p <0.0001)

Comment in

References

    1. Braak H, Del Tredici K, Rub U, De Vos RAI, Steur ENHJ, Braak E. Staging of brain pathology related to sporadic Parkinson’s disease. Neurobiology of Aging. 2003;24:197–211. - PubMed
    1. Fregni F, Simon DK, Wu A, Pascual-Leone A. Non-invasive brain stimulation for Parkinson’s disease: a systematic review and meta-analysis of the literature. Journal of Neurology Neurosurgery and Psychiatry. 2005;76:1614–23. - PMC - PubMed
    1. Elahi B, Elahi B, Chen R. Effect of Transcranial Magnetic Stimulation on Parkinson Motor Function-Systematic Review of Controlled Clinical Trials. Movement Disorders. 2009;24:357–63. - PubMed
    1. Nitsche MA, Paulus W. Excitability changes induced in the human motor cortex by weak transcranial direct current stimulation. Journal of Physiology-London. 2000;527:633–9. - PMC - PubMed
    1. Priori A, Berardelli A, Rona S, Accornero N, Manfredi M. Polarization of the human motor cortex through the scalp. Neuroreport. 1998;9:2257–60. - PubMed

Publication types

Associated data