. 2010 Dec 16;116(25):5536-47.
doi: 10.1182/blood-2010-08-299438. Epub 2010 Sep 24.

Critical roles for Rac GTPases in T-cell migration to and within lymph nodes

Affiliations

Critical roles for Rac GTPases in T-cell migration to and within lymph nodes

Mustapha Faroudi et al. Blood. .

Abstract

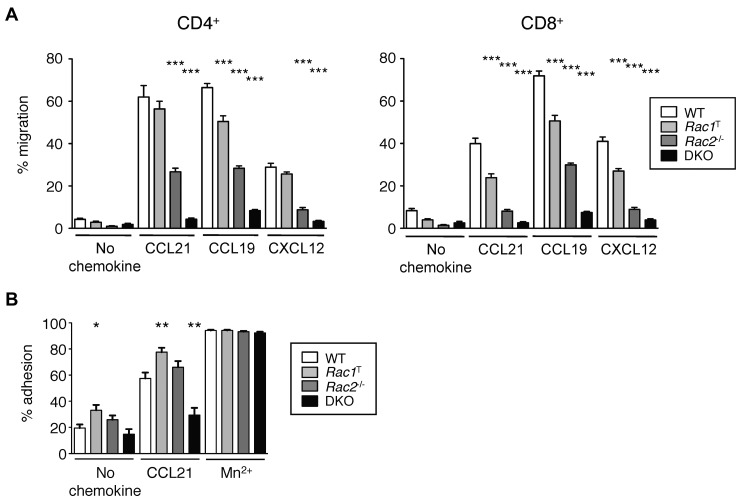
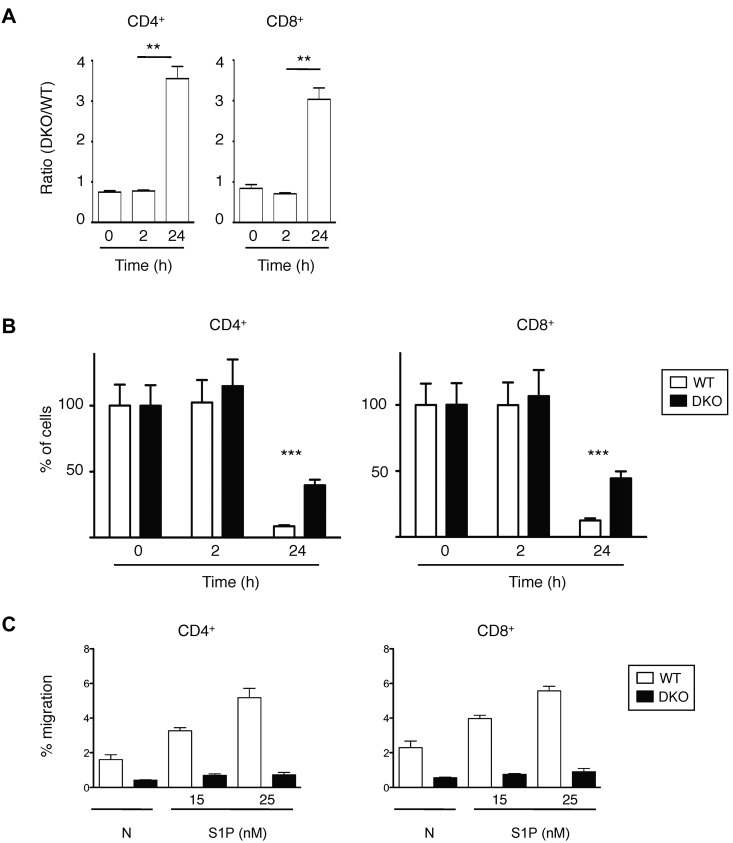
Naive T cells continuously recirculate between secondary lymphoid tissue via the blood and lymphatic systems, a process that maximizes the chances of an encounter between a T cell and its cognate antigen. This recirculation depends on signals from chemokine receptors, integrins, and the sphingosine-1-phosphate receptor. The authors of previous studies in other cell types have shown that Rac GTPases transduce signals leading to cell migration and adhesion; however, their roles in T cells are unknown. By using both 3-dimensional intravital and in vitro approaches, we show that Rac1- and Rac2-deficient T cells have multiple defects in this recirculation process. Rac-deficient T cells home very inefficiently to lymph nodes and the white pulp of the spleen, show reduced interstitial migration within lymph node parenchyma, and are defective in egress from lymph nodes. These mutant T cells show defective chemokine-induced chemotaxis, chemokinesis, and adhesion to integrin ligands. They have reduced lateral motility on endothelial cells and transmigrate in-efficiently. These multiple defects stem from critical roles for Rac1 and Rac2 in transducing chemokine and sphingosine-1-phosphate receptor 1 signals leading to motility and adhesion.


Figures

Figure 1
Figure 1
Rac1 and Rac2 are required for T-cell homing to T-cell areas of LN and spleen. (A, B) LN cells from mice of the indicated genotypes were mixed with LN cells from B6.SJL (Ly5.1+) mice at a 1:1 ratio and transferred intravenously into C57BL/6 recipient mice. Cells were harvested from the blood, PLN, MLN, and spleen either 1 hour (A) or 20 hours (B) after transfer. Graphs show mean ± SEM homing ratio of EYFP+ to Ly5.1+ T cells in the recovered cells normalized to the ratio of EYFP+ to Ly5.1+ T cells in the cells injected into the mice. Data in panel A are from 3 independent experiments (numbers of mice; PLN and spleen: WT, 18; DKO, 20; blood and MLN: WT, 6; DKO, 7). Data in panel B are from 6 independent experiments (numbers of mice: WT, 35; Rac1T, 28; Rac2−/−, 25; DKO, 27). *P < .05; **P < .01; ***P < .001. (C) CMTMR-labeled WT and CFSE-labeled DKO T cells were mixed (1:1 ratio), injected intravenously into C57BL/6 recipient mice (n = 3), and cells harvested from blood, spleen, and LNs 1 hour after transfer. Graph on left shows mean ± SEM homing ratio of DKO to WT T cells in the organs indicated, defined as the ratio of DKO to WT T cells in the recovered cells normalized to the same ratio in the injected cells. Images show immunofluorescence staining of section of spleen or LN from the recipient mice 1 hour after transfer with transferred WT and DKO T cells identified in red and green, respectively. Blue shows staining with anti-PNAd to identify HEV in LNs and anti-Madcam1 in spleen to identify the boundary between red and white pulp. Graph on right shows mean ± SEM ratio of DKO to WT T cells found either within or outside the HEV of LNs and in the red and white pulp of the spleen (15 different areas imaged/organ).
Figure 2
Figure 2
Rac1 and Rac2 are required for chemokine-induced chemotaxis and adhesion of T cells. (A) Graph shows mean ± SEM percentage migration of T cells in a Transwell assay in response to CCL21, CCL19, CXCL12, or in the absence of chemokine. (B) Graph shows mean ± SEM percentage adhesion of T cells of the indicated genotypes to immobilized ICAM-1 in response to CCL21, Mn2+, or no stimulus. Data are from 4 independent experiments. *P < .05; **P < .01; ***P < .001.
Figure 3
Figure 3
Rac GTPases are required for chemokine-induced adhesion to, migration on and transmigration through endothelium. WT and DKO T cells were allowed to attach to an endothelial monolayer at 0.24 dyne/cm2 for 5 minutes, and flow was then increased to 1 dyne/cm2 (high shear stress). Behavior of EYFP+ T cells was recorded by video microscopy. (A) Graph shows mean ± SEM percentage of EYFP+ T cells remaining attached on top of the endothelium after 5 minutes of high shear stress (either crawling or stationary) as a fraction of EYFP+ T cells at the start of the high shear stress period. (B) Flower plots show migration tracks of individual T cells of the indicated genotype, either on top of or below the endothelium, with the starting point of each track placed at the origin (0, 0). Cells that left the field of view during recording were not included. Note that in DKO plots there 44 and 39 cell tracks shown on top and below endothelium, respectively, but most are not clearly visible as they remain close to the origin. (C) Scatter plot of distance traveled by T cells on top of the endothelium. (D) Scatter plot of mean velocities of individual T cells on top of the endothelium. (E) Scatter plot of distance traveled by T cells below the endothelium. (F) Scatter plot of mean velocities of T cells below the endothelium. (G) Graph showing mean ± SEM percentage of T cells that had transmigrated through the endothelium by the end of the video recording (up to 55 minutes), as a fraction of EYFP+ T cells at the start of the high shear stress period. In panels C-F, red lines indicate means. Data are from 5 videos analyzed from 3 independent experiments. *P < .01; ***P < .001.
Figure 4
Figure 4
Interstitial movement of T cells within LNs. Purified WT EYFP+ T cells and EYFP+ T cells from Rac1T, Rac2−/−, or DKO mice were labeled with CFSE or CMTMR, mixed, and transferred into C57BL/6 recipient mice. Interstitial movement of labeled T cells within the popliteal LN was analyzed 15-72 hours later by multiphoton intravital video microscopy. All results are presented as a pair-wise comparison of WT with Rac1T, Rac2−/−, or DKO T cells. (A) Scatter plot of mean velocities of individual T cells. Red bar indicates the median of these velocities. (B) Graphs show the mean displacement of T cells as a function of √(time). The slope of this graph was used to determine the motility coefficient, a measure of the ability of a cell to move away from its starting position (Table 1)., (C) Turning angles of individual T cells measured as the change in direction of movement occurring between successive frames. (D) Top, a cumulative distribution plot of the meandering index (displacement/path length) of T cells of the indicated genotypes. Bottom, the median meandering index (± interquartile range). The meandering index is a measure of the straightness of track. WT v Rac1T: 13 videos analyzed from 6 independent experiments; WT v Rac2−/−: 14 videos analyzed from 9 independent experiments; WT v DKO: 7 videos analyzed from 4 independent experiments. *P < .001.
Figure 5
Figure 5
Defective chemokinesis in Rac-deficient T cells. (A) CD4+ T cells from mice of the indicated genotypes were cultured in the presence of CXCL12, CCL19, or CCL21 or with no chemokine, and their EYFP fluorescence was recorded by video microscopy. Images on the left show a snapshot from the videos. Flower plots on the right show migration tracks of individual cells, with the starting point of each track placed at the origin (0, 0). (B) Scatter plots of mean velocities of individual cells of the indicated genotypes taken from the videos described in panel A. Red bars indicate the average of these velocities. (C) Mean ± SEM shape index of cells of the indicated genotypes responding to the indicted stimulus derived from the videos described in panel A. A circle has a shape index of 1.0; any distortion from a perfect circle results in a shape index of > 1.0. Data are from 1 representative experiment of 2 independent experiments. *P < .05; **P < .01; ***P < .001.
Figure 6
Figure 6
Lymphocyte egress from LNs. (A) A mixture of WT and DKO T cells were transferred into C57BL/6 mice, and 12 hours later Mel-14 was injected into the mice to stop further entry into LNs. Graph shows mean ± SEM ratio of DKO to WT CD4+ or CD8+ T cells in LNs as a function of time after Mel-14 injection. The ratio was normalized to the ratio of DKO to WT T cells in the cells injected into the mice. (B) Graph shows percentage (mean ± SEM) CD4+ or CD8+ T cells remaining as a function of time after Mel-14 injection, normalized to the number of cells at 0 hours, which was set to 100%. Data in panels A and B are from 2 independent experiments. (C) Graph shows mean ± SEM percentage migration of WT or DKO EYFP+ T cells (CD4+ or CD8+) in a Transwell assay in response to S1P at the indicated concentrations, or in the absence of chemokine (N). Data are from 1 representative experiment of 2 independent experiments. *P < .01; ***P < .001.
Figure 7
Figure 7
Rac GTPases required for chemokine-induced cytoskeletal reorganization. (A) Mean ± SEM F-actin in CD4+ T cells of the indicated genotypes stimulated with CXCL12, CCL19, or CCL21 (200 ng/mL) or not stimulated. All F-actin measurements were normalized to F-actin content of unstimulated WT T cells. Data are from 4 independent experiments. (B) Mean ± SEM pERM in CD4+ T cells of the indicated genotypes stimulated with CCL21 (500 ng/mL) for the indicated times. All pERM measurements were normalized to WT T cells at time = 0 seconds. Data are from 3 independent experiments. *P < .05; **P < .01; ***P < .001.

Similar articles

Cited by

References

    1. Bromley SK, Mempel TR, Luster AD. Orchestrating the orchestrators: chemokines in control of T cell traffic. Nat Immunol. 2008;9(9):970–980. - PubMed
    1. Cahalan MD, Parker I. Choreography of cell motility and interaction dynamics imaged by two-photon microscopy in lymphoid organs. Annu Rev Immunol. 2008;26:585–626. - PMC - PubMed
    1. Okada T, Cyster JG. CC chemokine receptor 7 contributes to Gi-dependent T cell motility in the lymph node. J Immunol. 2007;178(5):2973–2978. - PubMed
    1. Asperti-Boursin F, Real E, Bismuth G, Trautmann A, Donnadieu E. CCR7 ligands control basal T cell motility within lymph node slices in a phosphoinositide 3-kinase-independent manner. J Exp Med. 2007;204(5):1167–1179. - PMC - PubMed
    1. Huang JH, Cardenas-Navia LI, Caldwell CC, et al. Requirements for T lymphocyte migration in explanted lymph nodes. J Immunol. 2007;178(12):7747–7755. - PubMed

Publication types

MeSH terms