

European mitochondrial DNA haplogroups and metabolic changes during antiretroviral therapy in AIDS Clinical Trials Group Study A5142
- PMID: 20871389
- PMCID: PMC2995830
- DOI: 10.1097/QAD.0b013e32833f9d02
European mitochondrial DNA haplogroups and metabolic changes during antiretroviral therapy in AIDS Clinical Trials Group Study A5142
Abstract
Background: Mitochondrial DNA (mtDNA) influences metabolic diseases and perhaps antiretroviral therapy (ART) complications. We explored associations between European mtDNA haplogroups and metabolic changes among A5142 participants.
Methods: Seven hundred and fifty-seven ART-naive patients were randomized to one of three class-sparing ART regimens including efavirenz and/or lopinavir/ritonavir with or without nucleoside reverse transcriptase inhibitors (NRTIs). Nonrandomized NRTIs included stavudine, tenofovir, or zidovudine, each with lamivudine. Fasting lipid profiles and whole-body dual-energy X-ray absorptiometry (DEXA) were performed. Nine European mtDNA haplogroups were determined for 231 self-identified non-Hispanic white individuals. Metabolic changes from baseline to 96 weeks were analyzed by haplogroup.
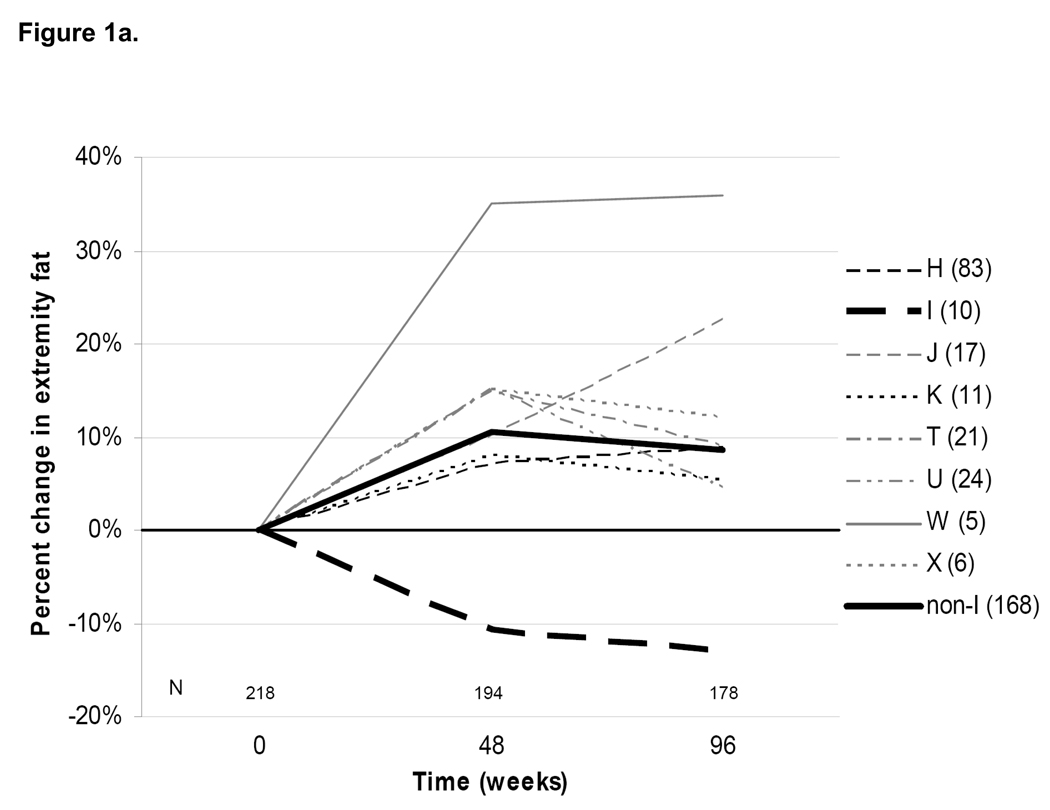
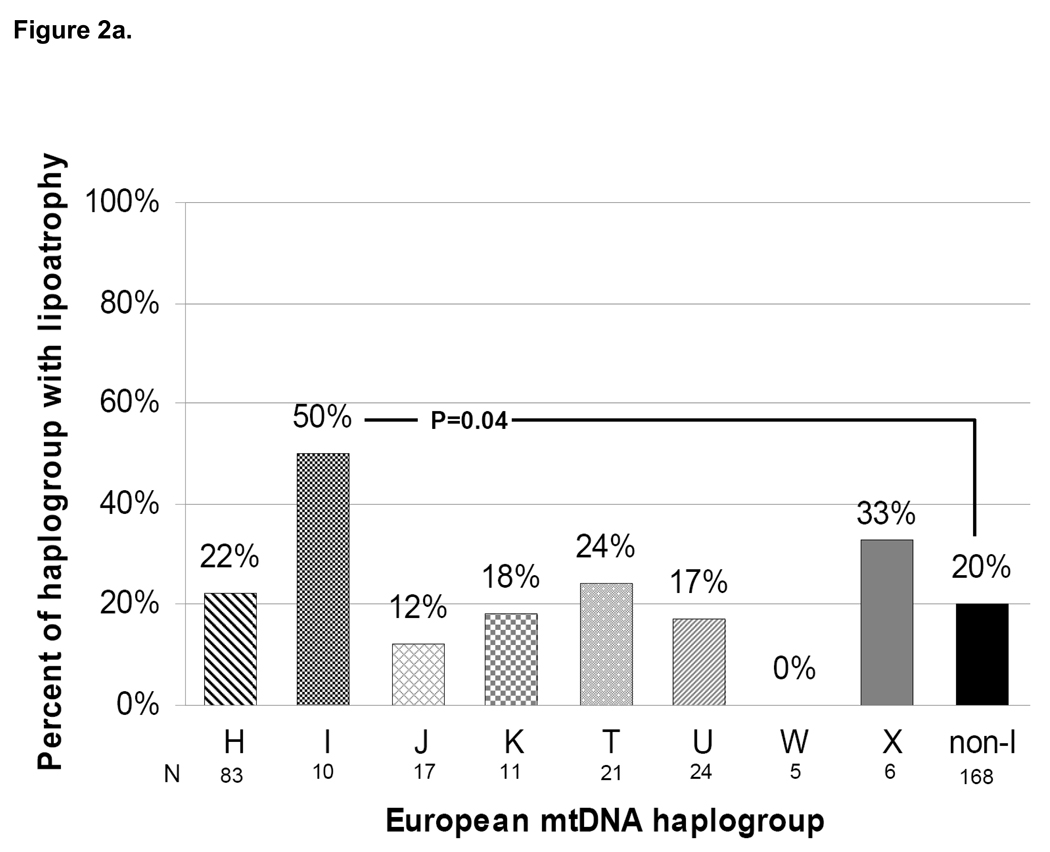
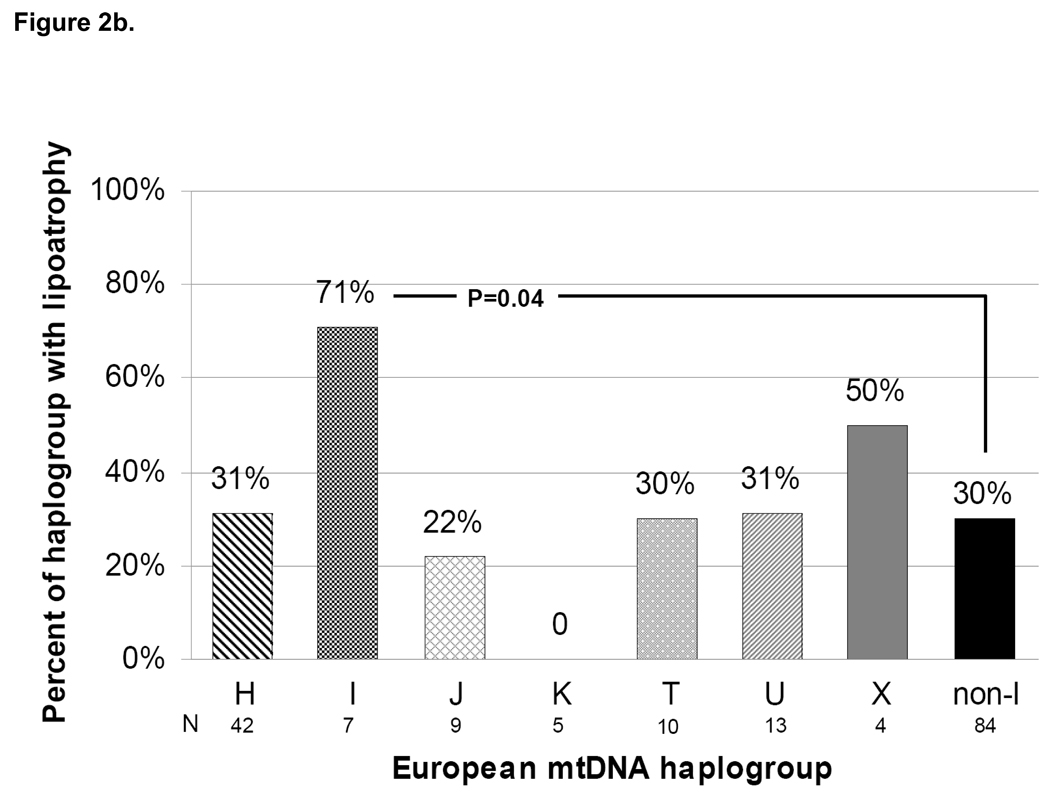
Results: Median age was 39 years, 9% were women, and 37, 32, and 30 were randomized to NRTI-containing regimens with either efavirenz or lopinavir/ritonavir, and an NRTI-sparing regimen, respectively. Among NRTI-containing regimens, 51% included zidovudine, 28% tenofovir, and 21% stavudine. Compared with other haplogroups, mtDNA haplogroup I (N = 10) had higher baseline non-HDL cholesterol [160 mg/dl (interquartile range 137-171) vs. 120 mg/dl (104-136); P = 0.005], a decrease in non-HDL cholesterol over 96 weeks [-14% (-20 to 6) vs. +25% (8 to 51); P < 0.001], tended to have more baseline extremity fat, and had more extremity fat loss by DEXA [-13% (-13 to 12) vs. +9% (-13 to 26); P = 0.08] and lipoatrophy (50 vs. 20%; P = 0.04). Haplogroup W (N = 5; all randomized to NRTI-sparing regimens) had the greatest increase in extremity fat [+35.5% (26.8 to 54.9); P = 0.02].
Conclusions: Lipids and extremity fat were associated with European mtDNA haplogroups in this HIV-infected population. These preliminary results suggest that mitochondrial genomics may influence metabolic parameters before and during ART.
Trial registration: ClinicalTrials.gov NCT00050895.
Conflict of interest statement
Potential conflicts of interest:
Dr. Hulgan reports having received research support from Merck.
Dr. Haubrich reports having received speaking honoraria or consultant fees from Abbott, Boehringer Ingelheim, Bristol-Myers Squibb, Gilead Sciences, Merck, Schering and Roche and has received research support from Abbott, GlaxoSmithKline, Pfizer and Tibotec.
Dr. Riddler reports having received lecture or consultation fees from Bristol-Myers Squibb and grant support from Schering-Plough and Hoffman-LaRoche.
Dr. Tebas reports having received consultation fees from Glaxo, Merck, Pfizer and Tibotec.
Dr. Ritchie reports having received consultation fees from Boehringer-Ingelheim.
Dr. McComsey reports having received speaking honoraria or consultant fees from Bristol-Myers Squibb, Gilead Sciences, GlaxoSmithKline and Abbott and has received research support from Bristol-Myers Squibb, GlaxoSmithKline, Merck, Gilead, and Abbott.
Dr. Haas has received research support from Bavarian Nordic, Boehringer-Ingelheim, Bristol-Myers Squibb, Gilead Sciences, Merck, and Tibotec, and has served on Scientific Advisory Boards for Boehringer-Ingelheim and Tibotec.
Dr. Canter reports no conflicts.
Figures

Similar articles
-
Metabolic outcomes in a randomized trial of nucleoside, nonnucleoside and protease inhibitor-sparing regimens for initial HIV treatment.AIDS. 2009 Jun 1;23(9):1109-18. doi: 10.1097/QAD.0b013e32832b4377. AIDS. 2009. PMID: 19417580 Free PMC article. Clinical Trial.
-
Body composition and metabolic outcomes after 96 weeks of treatment with ritonavir-boosted lopinavir plus either nucleoside or nucleotide reverse transcriptase inhibitors or raltegravir in patients with HIV with virological failure of a standard first-line antiretroviral therapy regimen: a substudy of the randomised, open-label, non-inferiority SECOND-LINE study.Lancet HIV. 2017 Jan;4(1):e13-e20. doi: 10.1016/S2352-3018(16)30189-8. Epub 2016 Nov 1. Lancet HIV. 2017. PMID: 27815068 Clinical Trial.
-
Hemochromatosis gene polymorphisms, mitochondrial haplogroups, and peripheral lipoatrophy during antiretroviral therapy.J Infect Dis. 2008 Mar 15;197(6):858-66. doi: 10.1086/528697. J Infect Dis. 2008. PMID: 18419350 Clinical Trial.
-
Dual antiretroviral therapy with tenofovir (TDF) and darunavir/ritonavir (DRV/RTV) in an HIV-1 positive patient: a case report, review, and meta-analysis of the literature on dual treatment strategies using protease inhibitors in combination with an NRTI.Infection. 2018 Oct;46(5):599-605. doi: 10.1007/s15010-018-1171-z. Epub 2018 Jun 30. Infection. 2018. PMID: 29961209 Review.
-
Lopinavir/ritonavir: a review of its use in the management of HIV infection.Drugs. 2003;63(8):769-802. doi: 10.2165/00003495-200363080-00004. Drugs. 2003. PMID: 12662125 Review.
Cited by
-
HIV and antiretroviral therapy-related fat alterations.Nat Rev Dis Primers. 2020 Jun 18;6(1):48. doi: 10.1038/s41572-020-0181-1. Nat Rev Dis Primers. 2020. PMID: 32555389 Review.
-
Mitochondrial genomics and CD4 T-cell count recovery after antiretroviral therapy initiation in AIDS clinical trials group study 384.J Acquir Immune Defic Syndr. 2011 Dec 1;58(4):363-70. doi: 10.1097/QAI.0b013e31822c688b. J Acquir Immune Defic Syndr. 2011. PMID: 21792066 Free PMC article. Clinical Trial.
-
Zidovudine exposure in HIV-1 infected Tanzanian women increases mitochondrial DNA levels in placenta and umbilical cords.PLoS One. 2012;7(7):e41637. doi: 10.1371/journal.pone.0041637. Epub 2012 Jul 27. PLoS One. 2012. PMID: 22848552 Free PMC article.
-
Mitochondrial genomics and antiretroviral therapy-associated metabolic complications in HIV-infected Black South Africans: a pilot study.AIDS Res Hum Retroviruses. 2013 Jul;29(7):1031-9. doi: 10.1089/aid.2012.0373. Epub 2013 Mar 15. AIDS Res Hum Retroviruses. 2013. PMID: 23428049 Free PMC article.
-
Perspectives on pharmacogenomics of antiretroviral medications and HIV-associated comorbidities.Curr Opin HIV AIDS. 2015 Mar;10(2):116-22. doi: 10.1097/COH.0000000000000134. Curr Opin HIV AIDS. 2015. PMID: 25565175 Free PMC article. Review.
References
-
- Niemi AK, Hervonen A, Hurme M, Karhunen PJ, Jylha M, Majamaa K. Mitochondrial DNA polymorphisms associated with longevity in a Finnish population. Hum Genet. 2003;112:29–33. Epub 2002 Oct 2017. - PubMed
-
- Kokaze A, Ishikawa M, Matsunaga N, Yoshida M, Sekine Y, Teruya K, et al. Association of the mitochondrial DNA 5178 A/C polymorphism with serum lipid levels in the Japanese population. Hum Genet. 2001;109:521–525. - PubMed
-
- Lal S, Madhavan M, Heng CK. The association of mitochondrial DNA 5178 C > a polymorphism with plasma lipid levels among three ethnic groups. Ann Hum Genet. 2005;69:639–644. - PubMed
Publication types
MeSH terms
Substances
Associated data
Grants and funding
- U01 AI046376/AI/NIAID NIH HHS/United States
- U01 AI069450/AI/NIAID NIH HHS/United States
- AI 32783/AI/NIAID NIH HHS/United States
- U01 AI069502/AI/NIAID NIH HHS/United States
- DA 12121/DA/NIDA NIH HHS/United States
- U01 AI069513/AI/NIAID NIH HHS/United States
- AI 069419/AI/NIAID NIH HHS/United States
- UM1 AI069494/AI/NIAID NIH HHS/United States
- UM1 AI069423/AI/NIAID NIH HHS/United States
- UM1 AI069472/AI/NIAID NIH HHS/United States
- U01 AI069474/AI/NIAID NIH HHS/United States
- R21 AI060484/AI/NIAID NIH HHS/United States
- U01 AI069447/AI/NIAID NIH HHS/United States
- UM1 AI069501/AI/NIAID NIH HHS/United States
- U01 AI069423/AI/NIAID NIH HHS/United States
- UM1 AI069513/AI/NIAID NIH HHS/United States
- AI 069465/AI/NIAID NIH HHS/United States
- U01 AI069434/AI/NIAID NIH HHS/United States
- AI 069423/AI/NIAID NIH HHS/United States
- AI 060354/AI/NIAID NIH HHS/United States
- M01 RR000096/RR/NCRR NIH HHS/United States
- AI 27673/AI/NIAID NIH HHS/United States
- M01 RR000046/RR/NCRR NIH HHS/United States
- R01 AI060484/AI/NIAID NIH HHS/United States
- U01 AI027661/AI/NIAID NIH HHS/United States
- AI 60484/AI/NIAID NIH HHS/United States
- UM1 AI069424/AI/NIAID NIH HHS/United States
- AI 069452/AI/NIAID NIH HHS/United States
- AI 069447/AI/NIAID NIH HHS/United States
- AI 32782/AI/NIAID NIH HHS/United States
- RR 02635/RR/NCRR NIH HHS/United States
- RR 00075/RR/NCRR NIH HHS/United States
- U01 AI069465/AI/NIAID NIH HHS/United States
- UM1 AI069434/AI/NIAID NIH HHS/United States
- AI 34853/AI/NIAID NIH HHS/United States
- K24 AI064086/AI/NIAID NIH HHS/United States
- UM1 AI069432/AI/NIAID NIH HHS/United States
- AI 069434/AI/NIAID NIH HHS/United States
- RR 00052/RR/NCRR NIH HHS/United States
- AI 46381/AI/NIAID NIH HHS/United States
- AI 069477/AI/NIAID NIH HHS/United States
- UM1 AI069411/AI/NIAID NIH HHS/United States
- AI 068634/AI/NIAID NIH HHS/United States
- U01 AI069470/AI/NIAID NIH HHS/United States
- UM1 AI069495/AI/NIAID NIH HHS/United States
- AI 069556/AI/NIAID NIH HHS/United States
- AI 069494/AI/NIAID NIH HHS/United States
- U01 AI069484/AI/NIAID NIH HHS/United States
- UM1 AI069471/AI/NIAID NIH HHS/United States
- AI 36214/AI/NIAID NIH HHS/United States
- U01 AI069439/AI/NIAID NIH HHS/United States
- U01 AI069556/AI/NIAID NIH HHS/United States
- AI 069471/AI/NIAID NIH HHS/United States
- U01 AI069418/AI/NIAID NIH HHS/United States
- AI 069411/AI/NIAID NIH HHS/United States
- TL1 RR024978/RR/NCRR NIH HHS/United States
- M01 RR000039/RR/NCRR NIH HHS/United States
- M01 RR000047/RR/NCRR NIH HHS/United States
- RR 00032/RR/NCRR NIH HHS/United States
- RR 00039/RR/NCRR NIH HHS/United States
- KL2 RR024977/RR/NCRR NIH HHS/United States
- AI 069501/AI/NIAID NIH HHS/United States
- U01 AI069532/AI/NIAID NIH HHS/United States
- UM1 AI069439/AI/NIAID NIH HHS/United States
- RR 00046/RR/NCRR NIH HHS/United States
- AI 50410/AI/NIAID NIH HHS/United States
- AI 064086/AI/NIAID NIH HHS/United States
- RR 00051/RR/NCRR NIH HHS/United States
- M01 RR002635/RR/NCRR NIH HHS/United States
- P30 AI045008/AI/NIAID NIH HHS/United States
- M01 RR000044/RR/NCRR NIH HHS/United States
- AI 069472/AI/NIAID NIH HHS/United States
- UM1 AI069470/AI/NIAID NIH HHS/United States
- UM1 AI068634/AI/NIAID NIH HHS/United States
- U01 AI069501/AI/NIAID NIH HHS/United States
- UM1 AI069484/AI/NIAID NIH HHS/United States
- AI 46376/AI/NIAID NIH HHS/United States
- RR 00096/RR/NCRR NIH HHS/United States
- UM1 AI069477/AI/NIAID NIH HHS/United States
- U01 AI069432/AI/NIAID NIH HHS/United States
- AI 25859/AI/NIAID NIH HHS/United States
- U01 AI038858/AI/NIAID NIH HHS/United States
- RR024975/RR/NCRR NIH HHS/United States
- U01 AI046370/AI/NIAID NIH HHS/United States
- AI 069495/AI/NIAID NIH HHS/United States
- U01 AI068636/AI/NIAID NIH HHS/United States
- UM1 AI069474/AI/NIAID NIH HHS/United States
- M01 RR000052/RR/NCRR NIH HHS/United States
- U01 AI034853/AI/NIAID NIH HHS/United States
- UL1 TR000454/TR/NCATS NIH HHS/United States
- RR 00047/RR/NCRR NIH HHS/United States
- UM1 AI069452/AI/NIAID NIH HHS/United States
- AI 69432/AI/NIAID NIH HHS/United States
- AI 64086/AI/NIAID NIH HHS/United States
- AI 069484/AI/NIAID NIH HHS/United States
- AI 45008/AI/NIAID NIH HHS/United States
- M01 RR000051/RR/NCRR NIH HHS/United States
- U01 AI069495/AI/NIAID NIH HHS/United States
- AI 069470/AI/NIAID NIH HHS/United States
- UM1 AI069556/AI/NIAID NIH HHS/United States
- AI 069432/AI/NIAID NIH HHS/United States
- U01 AI046381/AI/NIAID NIH HHS/United States
- M01 RR000032/RR/NCRR NIH HHS/United States
- AI 069450/AI/NIAID NIH HHS/United States
- U01 AI027673/AI/NIAID NIH HHS/United States
- AI 27661/AI/NIAID NIH HHS/United States
- P30 AI036214/AI/NIAID NIH HHS/United States
- AI 068636/AI/NIAID NIH HHS/United States
- UM1 AI069502/AI/NIAID NIH HHS/United States
- U01 AI025859/AI/NIAID NIH HHS/United States
- UM1 AI069450/AI/NIAID NIH HHS/United States
- UM1 AI069532/AI/NIAID NIH HHS/United States
- UM1 AI069465/AI/NIAID NIH HHS/United States
- U01 AI069424/AI/NIAID NIH HHS/United States
- AI 069418/AI/NIAID NIH HHS/United States
- U01 AI032782/AI/NIAID NIH HHS/United States
- UL1 RR024975/RR/NCRR NIH HHS/United States
- U01 AI069411/AI/NIAID NIH HHS/United States
- UM1 AI069419/AI/NIAID NIH HHS/United States
- UL1 RR025008/RR/NCRR NIH HHS/United States
- AI 069439/AI/NIAID NIH HHS/United States
- U01 AI069477/AI/NIAID NIH HHS/United States
- AI 069424/AI/NIAID NIH HHS/United States
- P30 AI060354/AI/NIAID NIH HHS/United States
- AI 069502/AI/NIAID NIH HHS/United States
- AI 38858/AI/NIAID NIH HHS/United States
- U01 AI069419/AI/NIAID NIH HHS/United States
- AI 069532/AI/NIAID NIH HHS/United States
- U01 AI069494/AI/NIAID NIH HHS/United States
- UM1 AI069447/AI/NIAID NIH HHS/United States
- AI 46370/AI/NIAID NIH HHS/United States
- U01 AI069452/AI/NIAID NIH HHS/United States
- U01 AI032783/AI/NIAID NIH HHS/United States
- AI 069513/AI/NIAID NIH HHS/United States
- U01 AI069471/AI/NIAID NIH HHS/United States
- U01 AI069472/AI/NIAID NIH HHS/United States
- AI 069474/AI/NIAID NIH HHS/United States
- RR 00044/RR/NCRR NIH HHS/United States
- U01 AI068634/AI/NIAID NIH HHS/United States
- UM1 AI068636/AI/NIAID NIH HHS/United States
- P30 AI050410/AI/NIAID NIH HHS/United States
- UM1 AI069418/AI/NIAID NIH HHS/United States
LinkOut - more resources
Full Text Sources
Medical
