. 2010 Oct;13(10):1240-8.
doi: 10.1038/nn.2639.

Emergence of cortical inhibition by coordinated sensory-driven plasticity at distinct synaptic loci

Affiliations

Emergence of cortical inhibition by coordinated sensory-driven plasticity at distinct synaptic loci

Ramesh Chittajallu et al. Nat Neurosci. 2010 Oct.

Abstract

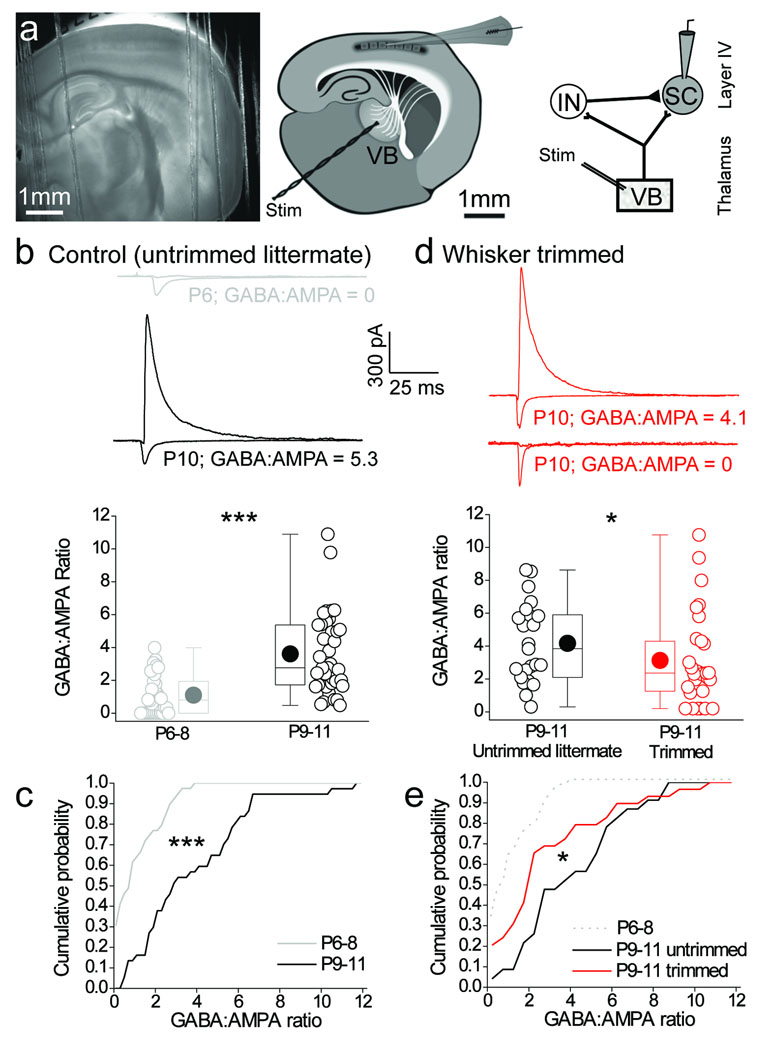
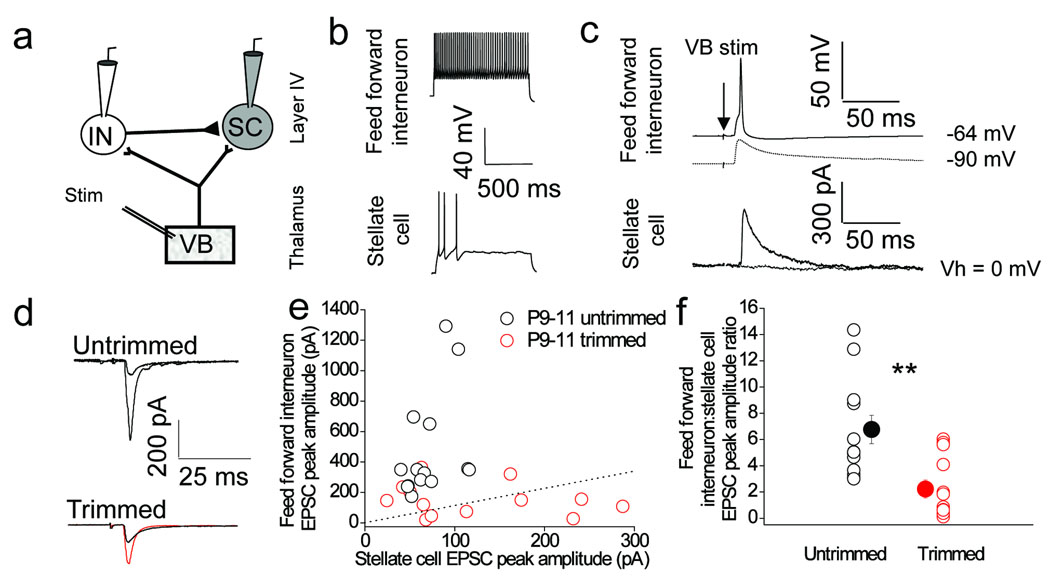
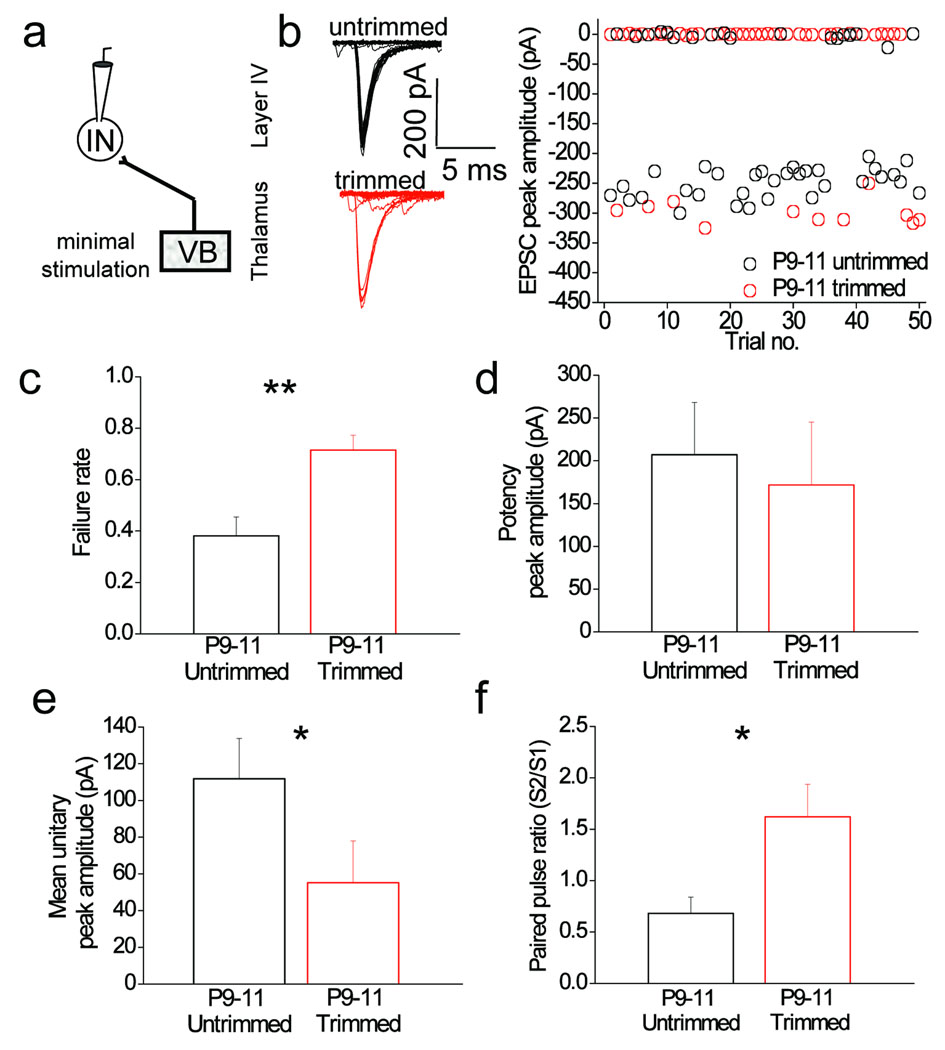
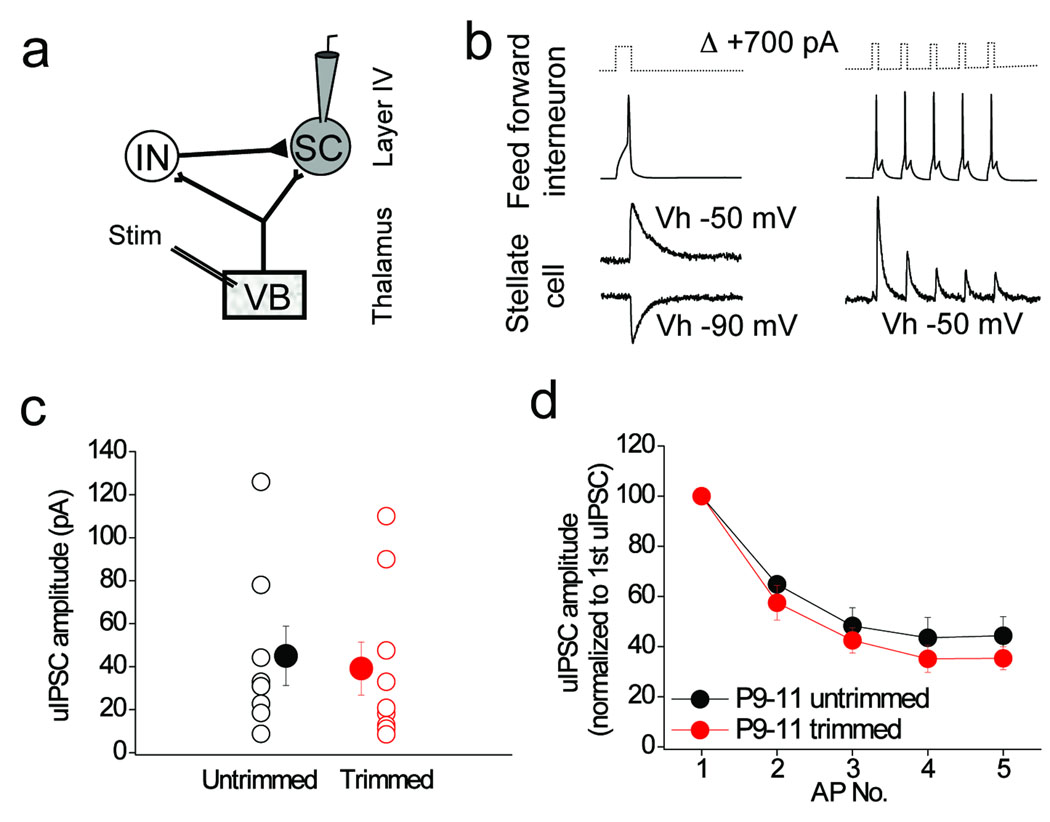
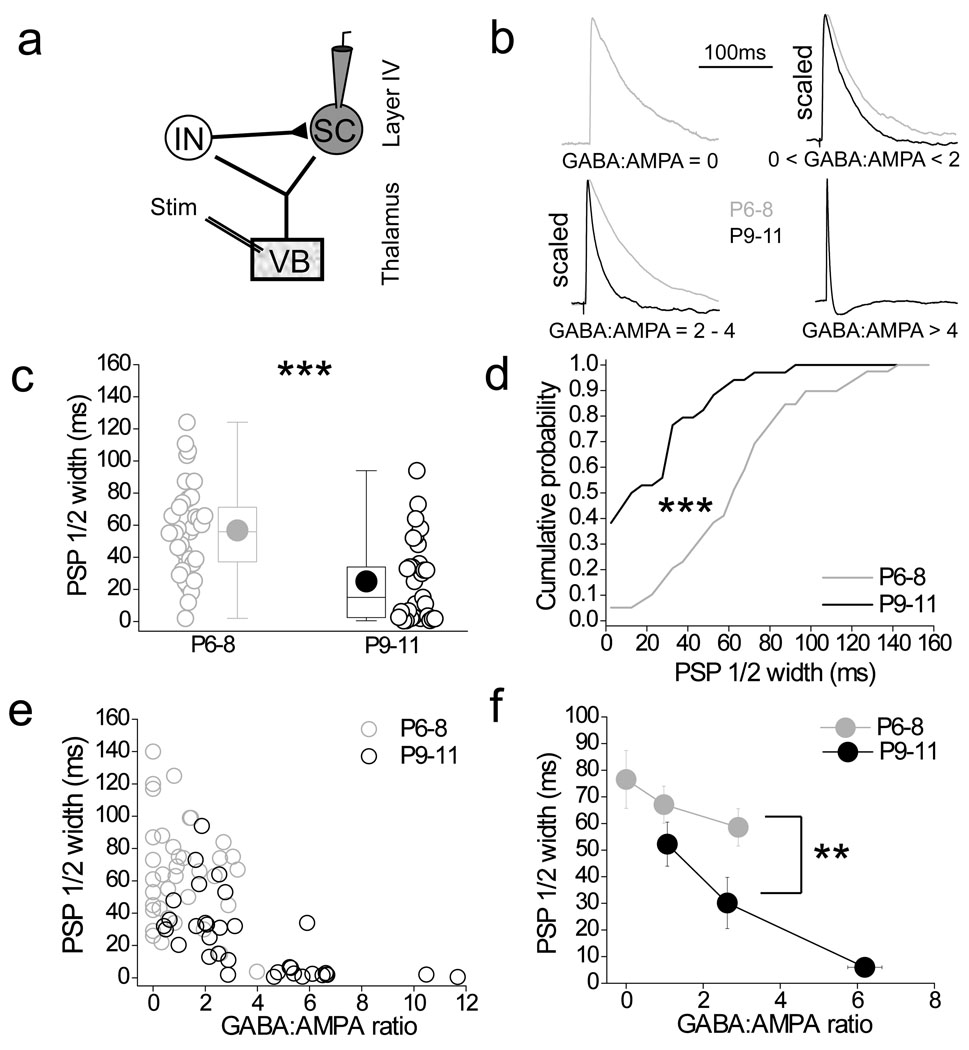
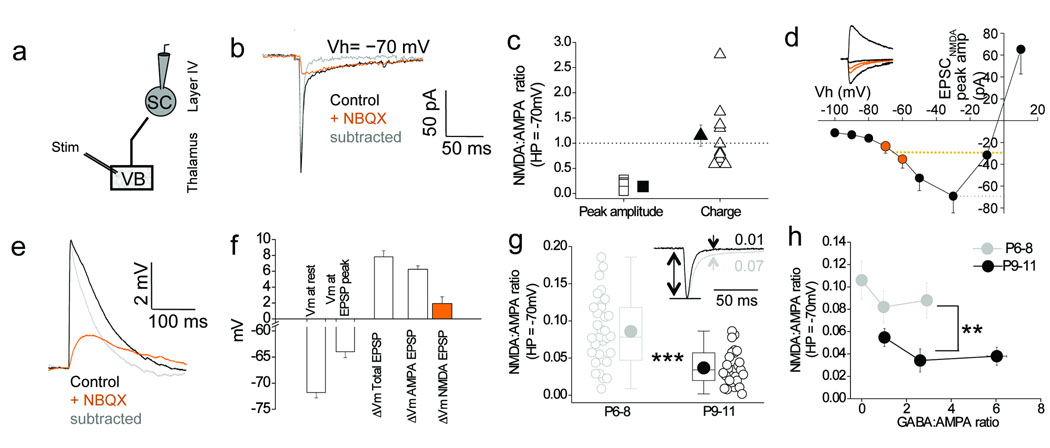
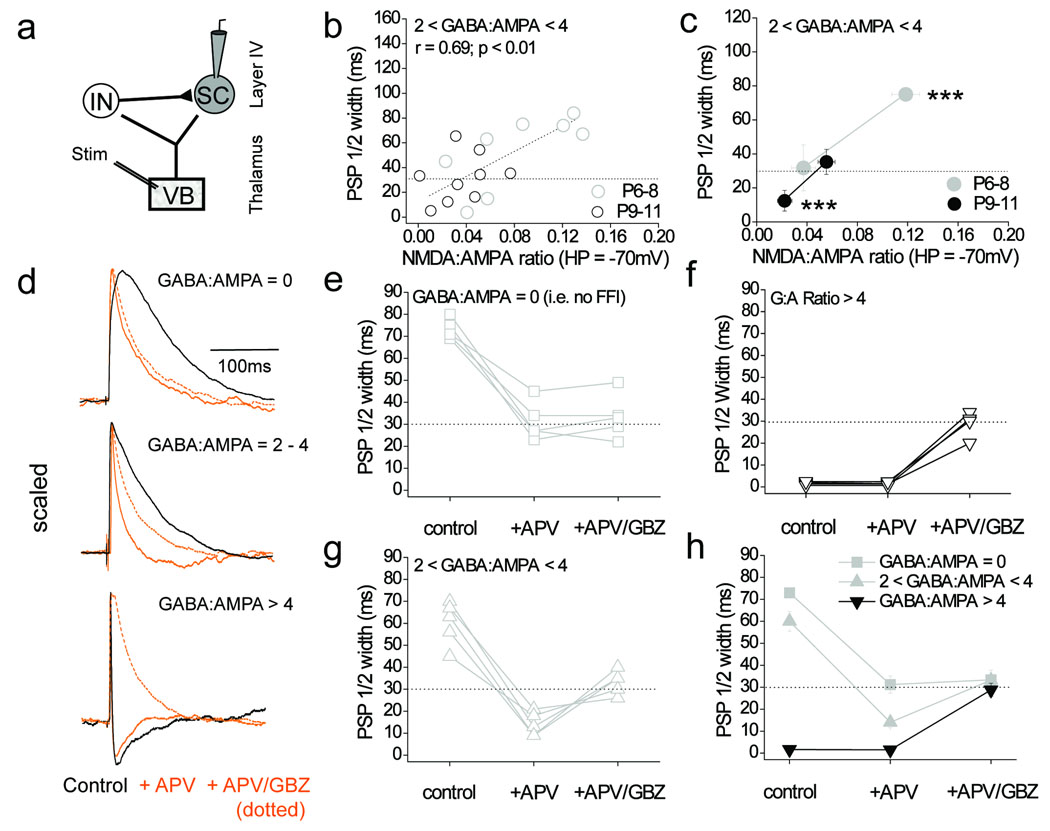
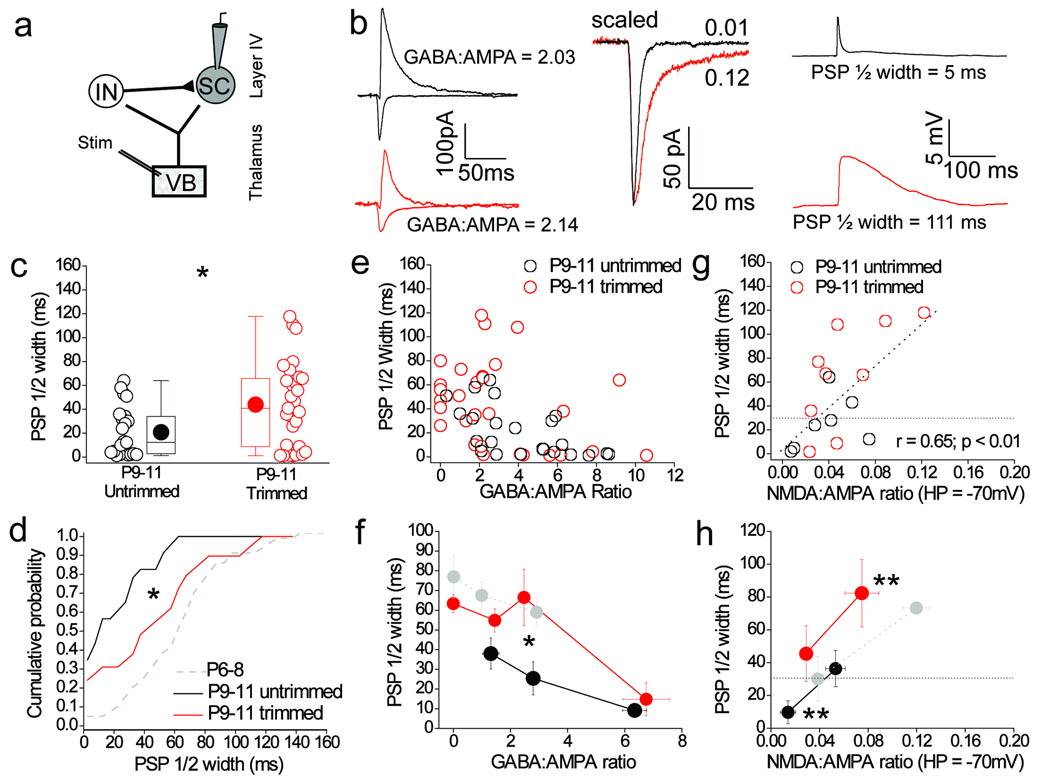
Feedforward GABAergic inhibition sets the dendritic integration window, thereby controlling timing and output in cortical circuits. However, the manner in which feedforward inhibitory circuits emerge is unclear, despite this being a critical step for neocortical development and function. We found that sensory experience drove plasticity of the feedforward inhibitory circuit in mouse layer 4 somatosensory barrel cortex in the second postnatal week via two distinct mechanisms. First, sensory experience selectively strengthened thalamocortical-to-feedforward interneuron inputs via a presynaptic mechanism but did not regulate other inhibitory circuit components. Second, experience drove a postsynaptic mechanism in which a downregulation of a prominent thalamocortical NMDA excitatory postsynaptic potential in stellate cells regulated the final expression of functional feedforward inhibitory input. Thus, experience is required for specific, coordinated changes at thalamocortical synapses onto both inhibitory and excitatory neurons, producing a circuit plasticity that results in maturation of functional feedforward inhibition in layer 4.


Figures

Figure 1
Figure 1. Sensory experience drives the developmental increase in feed–forward inhibitory input in layer 4 barrel cortex
(a) 4 × low–magnification DIC image of the thalamocortical slice, (left panel); schematic of the thalamocortical slice indicating placement of the bipolar stimulation electrode in the ventrobasal thalamus (VB) and site of whole–cell recording in layer 4 barrel field (center panel); Schematic of recording configuration depicting stimulation in VB to elicit a monosynaptic excitatory input and disynaptic feed–forward inhibition from the interneuron (IN) to the layer 4 stellate cell (SC; right panel). (b,c) Box–and–whisker/scatter plots (see methods for description) Eroorand cumulative frequency distributions of the amount of feed–forward inhibition calculated as the GABAA:AMPA peak amplitude ratio (GABA:AMPA ratio; see methods for details) during postnatal development for all individual stellate cells recorded and binned for P6–P8 and P9–11 age groups. The voltage clamp traces are from a stellate cell that displayed no feed–forward input at P6 (GABA:AMPA ratio = 0; gray traces) and one with a relatively large GABA:AMPA ratio at P10 (black traces). (d,e) Box–and–whisker/scatter plots and cumulative frequency distributions of the GABA:AMPA ratio for all individual stellate cells recorded at P9–11 in whisker–trimmed and untrimmed littermates. Voltage clamp traces are from a stellate cell that displayed a large (GABA:AMPA ratio = 4.1; upper red traces) and no (GABA:AMPA ratio = 0; lower red traces) feed–forward input in P9–11 whisker–trimmed animal. For comparison, the gray dotted line is re–plotted from the P6–8 data in c. n = 23–39. Two tailed Mann–Whitney U–test used for data in b,d and Kolmogorov–Smirnov test used for data in c,e; *p < 0.05, ***p < 0.001.
Figure 2
Figure 2. Sensory experience drives an increase in the relative strength of thalamocortical synaptic transmission onto feed–forward inhibitory interneurons
(a) Schematic of recording configuration depicting stimulation in VB thalamus and simultaneous whole–cell recording from a stellate cell and interneuron in layer 4 barrel cortex. (b) Voltage–responses to current injections demonstrating the firing patterns of the interneuron (160 pA injection; upper trace) and stellate cell (40 pA; lower trace). (c) Interneurons receiving a monosynaptic VB input capable of eliciting an action potential that is also synaptically connected to the stellate cell (solid traces) were defined as feed–forward interneurons. Hyperpolarizing the feed–forward interneuron resulting in VB input being sub–threshold and completely prevents the feed–forward IPSC measured in the stellate cell (dotted traces). (d) Representative voltage clamp traces of thalamocortical EPSCs from a simultaneous feed–forward interneuron and stellate cell recording in P9–11 trimmed and untrimmed littermates. (e) Scatter plot of the stellate cell and feed–forward interneuron EPSC peak amplitude relationship in P9–11 trimmed and untrimmed littermates. (f) stellate cell and feed–forward interneuron EPSC peak amplitude ratios in P9–11 trimmed and untrimmed littermates. Dotted lines in e and f correspond to EPSC peak amplitude ratio of 1. n = 13–14. Two tailed Mann–Whitney U–test used for data in f, **p < 0.01. Error bars are S.E.M.
Figure 3
Figure 3. Sensory experience causes a decrease in failure rate and alters paired pulse plasticity at thalamocortical synapses onto feed–forward inhibitory interneurons
(a) Schematic of recording configuration depicting whole–cell recordings from feed–forward intgerneurons in layer 4 barrel cortex. (b) Example traces of unitary thalamocortical EPSCs from feed–forward–interneurons in a P10 untrimmed and a whisker–trimmed littermate evoked via minimal stimulation (see methods). Plot of unitary peak EPSC amplitude from the untrimmed and whisker–trimmed littermate. (c) Failure rate of thalamocortical mediated unitary EPSCs onto feed–forward interneuron in untrimmed and whisker–trimmed littermates. (d) Potency of thalamocortical unitary EPSCs (excluding failures) onto feed–forward interneuron in untrimmed and whisker–trimmed littermates. (e) Mean peak amplitudes (including failures) of thalamocortical unitary EPSCs onto feed–forward interneuron in untrimmed and whisker–trimmed littermates. (f) Paired pulse ratio (S2/S1) of mean peak amplitudes of thalamocortical unitary EPSCs thalamocortical unitary EPSCs onto feed–forward interneuron in untrimmed and whisker–trimmed littermates. n = 7–8. Two tailed Mann–Whitney U–test used for data in c–f ; *p < 0.05. Error bars are S.E.M.
Figure 4
Figure 4. Sensory experience does not alter synaptic transmission or connectivity between feed–forward interneurons and stellate cells in layer 4
(a) Schematic of recording configuration depicting whole–cell recordings from pairs of feed–forward interneurons and stellate cells in layer 4 barrel cortex. (b) Example traces demonstrating a connected feed–forward interneuron (action potential elicited by either a single 5 ms, +700 pA current injection, left traces, or 5 action potentials delivered at 50Hz, right traces) and stellate cell pair. The unitary postsynaptic current in the stellate cell is symmetrical around −70 mV as expected from a GABAA–receptor mediated response under the conditions of the experiment. (c) Unitary IPSC amplitudes in stellate cells in P9–11 trimmed (n=8) and untrimmed littermates (n=9). Means not significantly different (p > 0.05; two–tailed Mann–Whitney U–test). (d) Short term plasticity of feed–forward interneuron to stellate cell unitary IPSCs in P9–11 trimmed (n = 4) and untrimmed littermates (n–5). Error bars are S.E.M.
Figure 5
Figure 5. Lack of effective feed–forward inhibition in a subpopulation of stellate cells despite the presence of a relatively large feed–forward inhibitory input
(a) Schematic of recording configuration. (b) Representative current–clamp traces showing the PSP time–course in stellate cells following VB stimulation. Traces are taken from stellate cells displaying a range of GABA:AMPA ratios as indicated from P6–8 (gray traces) and P9–11 (black traces) age groups. (c,d) Box–and–whisker/scatter plots and cumulative distributions of PSP half width at P6–8 (n = 38) and P9–11 (n = 32). (e) Correlation plot of GABA:AMPA ratio versus PSP half width for P6–8 (n = 38) and P9–11 (n = 32). (f) Pooled data of the correlation between GABA:AMPA ratio and PSP half width (data were binned according to GABA:AMPA ratios as follows; GABA:AMPA ratio = 0, GABA:AMPA = 0–2, GABA:AMPA ratio = 2–4 and GABA:AMPA ratio > 4; for each data point n = 9–16). Two tailed Mann–Whitney U–test used for data in c, f and Kolmogorov–Smirnov test used for data in d; **p < 0.01, ***p < 0.001. Error bars in (f) are S.E.M.
Figure 6
Figure 6. An NMDA–receptor mediated component to the thalamocortical synaptic response is prominent at resting membrane potential in P6–8 stellate cells and is developmentally down–regulated
(a) Schematic of recording configuration. (b) Representative voltage–clamp traces of the thalamocortical EPSC in a P8 stellate cell at an holding potential (Vh) of −70 mV. (c) Ratio of NMDA:AMPA receptor–mediated peak current amplitude (orange squares) and charge (orange triangles) measured at Vh of −70 mV in P6–8 stellate cells (n=10). Dotted line indicates NMDA:AMPA ratio of 1. (d) Pooled I/V relationship of NMDA EPSC in P6–8 stellate cells (n = 6). Orange dotted line corresponds to the NMDA EPSC peak current amplitude between −60 and −70 mV (closely corresponding to the range of resting potentials measured in P6–8 stellate cells); black dotted line is the maximal NMDA EPSC. Representative traces in inset. For clarity only the EPSCNMDA at −90, −70, −60, −30 and +10 mV are shown. Orange traces are NMDA EPSCs at −60 and −70 mV. (e) Representative thalamocortical EPSPs (P8 stellate cell; resting potential −68 mV). (f) Pooled data for analysis of EPSP in stellate cells (n=6). (g) Box–and–whisker/scatter plots of the NMDA:AMPA ratio at −70 mV for P6–8 (n = 32) and P9–11 (n = 27). Inset: two EPSCs at P6–8 and P9–11. (h) NMDA:AMPA ratio plotted vs. binned GABA:AMPA ratio (same cells as in h). Two tailed Mann–Whitney U–test used for data in g, h; **p < 0.01, ***p < 0.001. Error bars are S.E.M.
Figure 7
Figure 7. The prominent thalamocortical NMDA component prolongs the PSP to offset the effects of feed–forward inhibiton
(a) Schematic of recording configuration. (b) Scatter plot illustrating a strong correlation in the relationship between NMDA:AMPA ratio (at HP = −70 mV) vs. the PSP half width in stellate cells that display a GABA:AMPA ratio between 2 and 4 for P6-8 (n=8) and P9-11 (n=9). (c) Binned data for the relationship between NMDA:AMPA ratio and PSP half width. *** indicates data points between which both the mean PSP half width and NMDA:AMPA ratio are significantly different to each other (two tailed Mann–Whitney U–test, p < 0.001). (d) Representative traces of pharmacological manipulations as indicated of thalamocortical PSPs in stellate cells with different GABA:AMPA ratios. All EPSPs are scaled to the peak. (e) PSP half widths in P6–8 stellate cells (n = 5) with a GABA:AMPA ratio of 0, in control, in 50 µM APV and in 50 µM APV + 10 µM GBZ. (f) PSP half widths for P9–11 stellate cells (n=4) with a GABA:AMPA ratio > 4 (as for E). (g) PSP half widths for P6–8 stellate cells (n=5) with a GABA:AMPA ratio between 2 and 4 (as for E). (h) Pooled data of the effects of D–APV and D–APV/GBZ application on the PSP half width. Black dotted line in b, c, e–h is half width of the pharmacologically isolated AMPA–receptor mediated thalamocortical EPSP. Error bars are S.E.M.
Figure 8
Figure 8. Sensory experience increases truncation mediated by a given amount of feed forward inhibiton via reduction of the NMDA–receptor mediated component
(a) Schematic of recording configuration. (b) Left panel: voltage clamp traces from two stellate cells in P10 trimmed (red traces) and untrimmed littermate (black traces) displaying very similar GABA:AMPA ratios. Middle panel: close–up of EPSCs (scaled) shown in left panel demonstrating the larger NMDA:AMPA ratio (at HP = −70 mV) in trimmed (red trace) and untrimmed mice (black trace). Right panel: current–clamp traces from the same cells showing the prolonged PSP half width in whisker–trimmed mice. (c,d). Box–and–whisker/scatter plots and cumulative frequency distributions of PSP half widths in all stellate cells tested from trimmed P9–11 (n = 29) and untrimmed littermates (n = 23). Data from same cells as in Figure 1d, e. Gray data from P6–8 re–plotted from Fig. 5d for comparison. (e) GABA:AMPA ratio versus PSP half width for stellate cells in P9–11 trimmed (n = 23) and untrimmed littermates (n = 29). (f) GABA:AMPA ratio vs. PSP half width binned according to GABA:AMPA ratio. Gray data is P6–8 data re–plotted (from Fig. 5f) for comparison. (g) NMDA:AMPA ratio (at HP = −70 mV) vs. PSP half width in stellate cells with a GABA:AMPA ratio between 2 and 4 from P9–11 trimmed (red; n = 9) and untrimmed (black; n = 7) littermates. (h) Binned data of NMDA:AMPA ratio vs. PSP half width in stellate cells with a GABA:AMPA ratio between 2 and 4 in P9–11 whisker–trimmed (red) and untrimmed littermates (black). ** indicates points between which both the mean PSP half width and NMDA:AMPA ratio are significantly different to each other (two tailed Mann–Whitney U–test, p < 0.01). Gray data is P6–8 data re–plotted (from Fig. 6c) for comparison. The black dotted line in g and h is half width of the pharmacologically–isolated AMPA–receptor mediated EPSP. Two tailed Mann–Whitney U–test used for data in c, f, h and Kolmogorov–Smirnov test used for data in d; **p < 0.01; *p < 0.05. Error bars in (f) and (g) are S.E.M.

References

    1. Woolsey TA, Van der Loos H. The structural organization of layer IV in the somatosensory region (SI) of mouse cerebral cortex. The description of a cortical field composed of discrete cytoarchitectonic units. Brain Res. 1970;17:205–242. - PubMed
    1. Bureau I, von Saint Paul F, Svoboda K. Interdigitated paralemniscal and lemniscal pathways in the mouse barrel cortex. PLoS Biol. 2006;4:e382. - PMC - PubMed
    1. Petreanu L, Mao T, Sternson SM, Svoboda K. The subcellular organization of neocortical excitatory connections. Nature. 2009;457:1142–1145. - PMC - PubMed
    1. Porter JT, Johnson CK, Agmon A. Diverse types of interneurons generate thalamus-evoked feedforward inhibition in the mouse barrel cortex. J Neurosci. 2001;21:2699–2710. - PMC - PubMed
    1. Swadlow HA. Thalamocortical control of feed-forward inhibition in awake somatosensory 'barrel' cortex. Philos Trans R Soc Lond B Biol Sci. 2002;357:1717–1727. - PMC - PubMed

Publication types

MeSH terms