. 2010 Nov;5(11):798-806.
doi: 10.1038/nnano.2010.177. Epub 2010 Sep 26.

Replication of individual DNA molecules under electronic control using a protein nanopore

Affiliations

Replication of individual DNA molecules under electronic control using a protein nanopore

Felix Olasagasti et al. Nat Nanotechnol. 2010 Nov.

Abstract

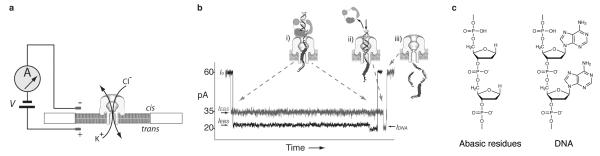
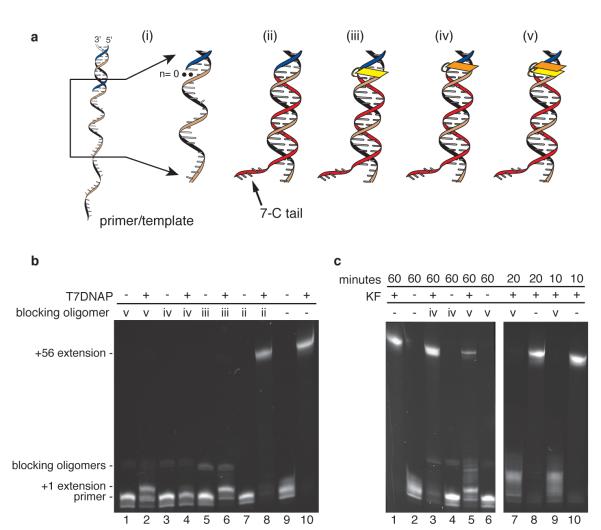
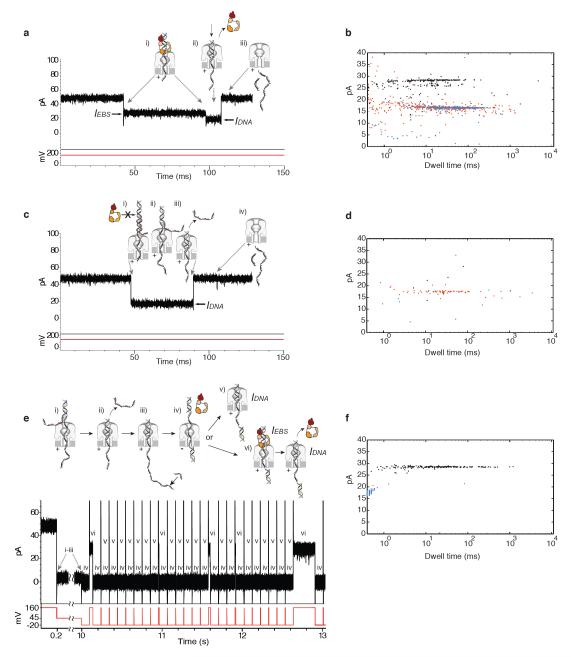
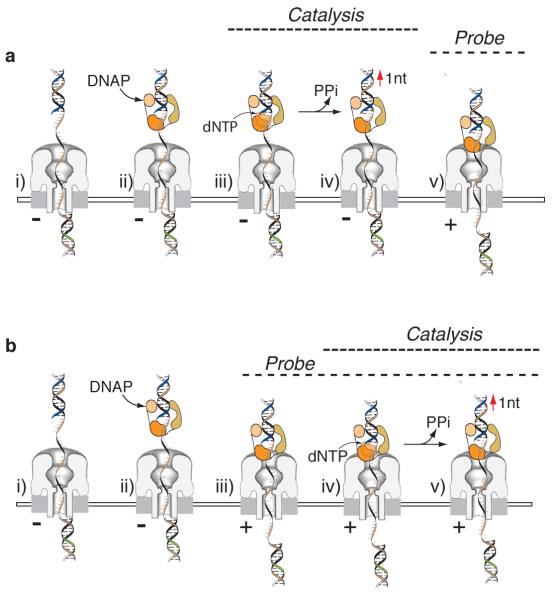
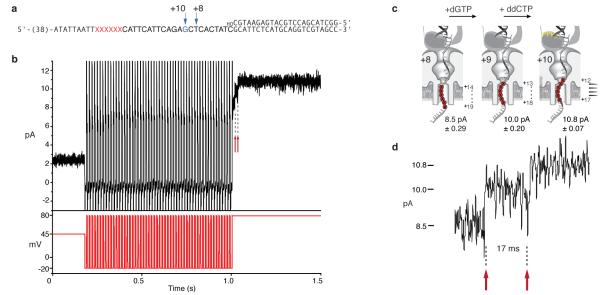
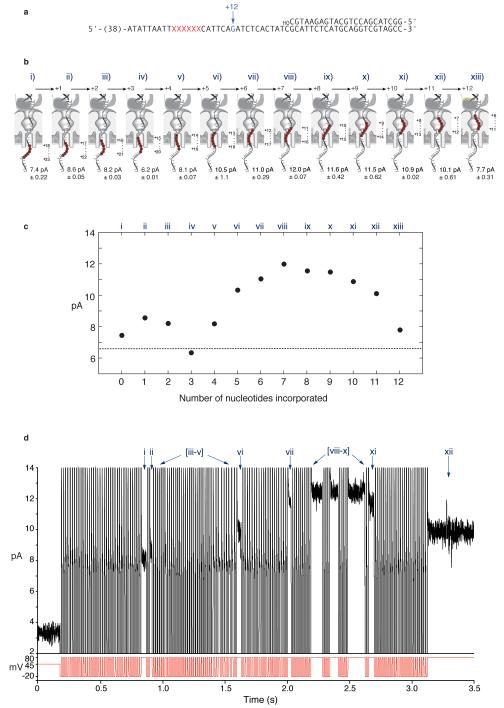
Nanopores can be used to analyse DNA by monitoring ion currents as individual strands are captured and driven through the pore in single file by an applied voltage. Here, we show that serial replication of individual DNA templates can be achieved by DNA polymerases held at the α-haemolysin nanopore orifice. Replication is blocked in the bulk phase, and is initiated only after the DNA is captured by the nanopore. We used this method, in concert with active voltage control, to observe DNA replication catalysed by bacteriophage T7 DNA polymerase (T7DNAP) and by the Klenow fragment of DNA polymerase I (KF). T7DNAP advanced on a DNA template against an 80-mV load applied across the nanopore, and single nucleotide additions were measured on the millisecond timescale for hundreds of individual DNA molecules in series. Replication by KF was not observed when this enzyme was held on top of the nanopore orifice at an applied potential of 80 mV. Sequential nucleotide additions by KF were observed upon applying controlled voltage reversals.


Figures

Figure 1
Figure 1. The nanopore device
a, A patch-clamp amplifier supplies voltage and measures ionic current through a single α-hemolysin channel inserted in a ~30-μm diameter lipid bilayer. Current through the nanopore is carried by K+ and Cl ions. b, Characteristic current blockade event structure for A family DNAP-DNA complexes captured in the nanopore. The black current trace corresponds to a KF-DNA complex formed with a substrate composed solely of standard DNA residues; the charcoal current trace is for a KF-DNA complex formed with a substrate bearing an insert of six consecutive abasic residues in the template strand. Cartoons i-iii illustrate the molecular events that correspond to each current level ,, with the abasic residues indicated as red circles. The initial longer blockade (i) is the enzyme bound state (IEBS) observed upon capture of a DNAP-DNA complex, with the duplex DNA held atop the pore vestibule by the polymerase. The amplitude of this initial segment is increased when abasic residues are positioned to reside in the nanopore lumen during the EBS . The shorter terminal step (IDNA; ii) occurs upon voltage-promoted DNAP dissociation, when the duplex DNA is drawn into the nanopore vestibule. Electrophoresis of the unbound DNA through the nanopore (iii) restores the open channel current (60+/−2 pA at 180 mV in buffer containing 0.3 M KCl). This event structure is observed for DNAP-DNA binary complexes and for DNAP-DNA-dNTP ternary complexes, with both KF and T7DNAP. Average EBS duration for DNA substrates bearing a 3′-H terminated primer is increased in the presence of correct dNTP in a concentration-dependent manner ,. c, Structure of abasic residues. A section of a strand bearing abasic (1′,2′-dideoxy) residues is compared to a section of a DNA strand, in which the nucleobases at the 1′ position are represented as unsubstituted purines.
Figure 2
Figure 2. Blocking oligomer inhibition of DNAP-catalyzed DNA synthesis
a, (i) DNA polymerase substrate consisting of a 79 mer template strand (tan and black) and a 23 mer primer strand (dark blue). The primer/template junction where DNA polymerase binds and initiates replication at the first unpaired base (n=0) and the single-stranded region of the template just beyond the 3′ end of the primer strand, are magnified. This region is the target for a series of oligonucleotides (ii-v) tested for their ability to inhibit DNA synthesis in the bulk phase bathing the nanopore. These oligomers (in red) are (ii) a standard DNA oligonucleotide complementary to 25 template nucleotides, extended on its 3′ end by 7 non-complementary cytosine residues; (iii) the oligonucleotide shown in (ii), with a single acridine residue, represented in yellow, at its 5′ terminus. This acridine replaces the nucleobase that participates in the terminal base pair of the fully base paired segment of (ii); (iv) the oligonucleotide shown in (ii), with its 5′ terminus extended by a single acridine overhang, represented in orange; and (v) the oligonucleotide shown in (ii), with two acridine residues at its 5′ terminus. In (v), one acridine residue, (yellow), replaces the nucleobase that participates in the terminal base pair of the fully base paired segment of (ii) and a second acridine residue (orange), is an overhang. b, Inhibition of T7DNAP-catalyzed primer extension. Denaturing gel electrophoresis showing the effect of the blocking oligomers shown in panel a, ii-v, on primer extension catalyzed by T7DNAP for 60 minutes under nanopore buffer conditions. The location of bands corresponding to the 5′-6-FAM primer, the +1 extension product, and the full-length extension product (+56) are indicated. Also indicated is the location of bands arising from the fluorescence of the acridine moieties of blocking oligomers iii-v. The presence of these bands in lanes for reactions conducted with (lanes 1, 3, 5) and without (lanes 2, 4, 6) enzyme confirms that they are not extension products. c, Inhibition of KF-catalyzed primer extension. Denaturing gel electrophoresis showing the effect of blocking oligomers iv and v shown in panel a on primer extension catalyzed by KF under nanopore buffer conditions in 60 minutes (left panel), or 10 and 20 minutes (right panel).
Figure 3
Figure 3. Blocking oligomer inhibition of bulk phase T7DNAP binding and voltage-promoted deprotection of individual DNA substrate molecules
a, Characteristic current blockade event structure for T7DNAP-DNA complexes captured in the nanopore. Cartoons i-iii illustrate the molecular events that correspond to each current level (see Figure 1b for a detailed description). b, Dwell time vs. amplitude plot for an experiment in which hundreds of T7DNAP-DNA-dNTP ternary complexes were captured. In dwell time vs. amplitude plots in panels b, d , and f the IEBS segments of the polymerase-DNA events are represented as black dots, the lower amplitude, terminal portion of the polymerase-DNA events as blue dots, and unbound DNA events as red dots (for a description of how events were identified and quantified, see the Methods section). c, Representative current trace for events observed when the primer/template substrate used in panels a and b is pre-annealed with a blocking oligomer bearing a single acridine overhang at its 5′ terminus (Fig. 2a, iv). (i) The blocked DNA substrate is captured. The 7 nucleotide non-complementary 3′ tail is designed to promote blocking oligomer dissociation upon nanopore capture (ii-iii). In concert with blocking oligomer dissociation the primer/template junction is drawn into the pore vestibule (iii). Open channel current is restored (iv) upon electrophoresis of the DNA through the pore. d, Dwell time vs. amplitude plot for the experiment that produced the current trace in panel c. Numerous unbound IDNA events at 18 pA, but almost no 28 pA IEBS events, were observed. e, Voltage-promoted deprotection of individual DNA substrate molecules renders them accessible for T7DNAP binding. Lower case Roman numerals (i-vi) in the current trace correspond to the states depicted in the cartoons above. Upon capture (+160 mV) of a protected DNA substrate pre-annealed with the blocking oligomer (i), the 7-dC tail of the blocking oligomer is unzipped as the DNA substrate is driven into the pore, where the primer/template junction is protected from polymerase binding (ii). This state is detected by the FSM, voltage is reduced (+45 mV) and the template strand in the trans compartment can anneal to a tethering oligomer (iii). The potential is reversed (-20 mV) to drive the newly deprotected DNA primer/template into the cis compartment where it is exposed to T7DNAP and dGTP and can form a ternary complex (iv). The duration of this ‘fishing’ exposure can be precisely controlled and was 100 ms in the experiment shown. After the programed fishing exposure, voltage is again reversed (to +160 mV in the experiment shown), drawing the DNA substrate back to the nanopore orifice. In this ‘probing’ step, either unbound DNA (IDNA; v) or a T7DNAP-bound molecule is drawn back to the pore (IEBS; vi). Detection of IEBS indicates the blocking oligomer was removed and the DNA substrate was thus made accessible for polymerase binding. Detection of IDNA in (v), or of IDNA following voltage-promoted dissociation of the enzyme in (vi), prompts voltage reversal to −20 mV to fish again after a 2 ms delay. The fish and probe cycle is iterative until the DNA molecule is ejected, whereupon another can be captured. f, Dwell time vs. amplitude plot for hundreds of IEBS events measured in iterative fish and probe cycles for dozens of individually DNA substrate molecules captured and deprotected in series. Note that in this panel, the duration of the terminal portion of enzyme-bound events (after polymerase dissociation), represented by the blue dots, is truncated by the FSM logic, which upon recognition of this lower amplitude state in which the DNA duplex has dropped into the vestibule, commands a rapid voltage reversal.
Figure 4
Figure 4. Nucleotide addition may occur above the nanopore orifice (prior to the probing step) or at the nanopore orifice (during the probing step)
a, Nucleotide addition above the nanopore orifice prior to the probing step. i) The trans-side oligomer has been annealed following blocking oligomer removal. The trans-side voltage is negative driving the dsDNA/ssDNA junction into the cis compartment (fishing step). ii) During the fishing step, DNAP (ii) and cognate dNTP (iii) may sequentially bind. iv) This can lead to catalytic nucleotide addition and translocation of the DNA substrate relative to the DNAP prior to the probing step (v) when the voltage is reversed (trans-side +). In this scenario, the product of DNA catalysis is detected by the nanopore, but the catalytic cycle itself is not detected. b, Nucleotide addition at the nanopore orifice during the probing step. In this scenario, steps (i) and (ii) are the same as in scenario ‘a’. However, here the probing step (iii) precedes and then is sustained during catalytic turnover and translocation (iv-v). In this scenario, the catalysis is observed in process. The abbreviation ‘PPi’ refers to pyrophosphate.
Figure 5
Figure 5. T7DNA replication of individual DNA substrate molecules deprotected and tethered in the nanopore
a, Primer/template substrate used in T7DNAP replication experiments. The first G residue at position 33 of the template is shown in blue, and the six abasic residues are shown as red Xs. Sequences at the 5′ end of the template, which include the binding site for the tethering oligomer on the trans side of the nanopore, are not shown. b, Representative current trace for a captured molecule in which T7DNAP catalyzed the addition of 10 nucleotides. Following 55 sequential 10 ms fishing exposures and 80 mV probing steps, a progression through three detectable EBS amplitude levels (8.5, 10, and the 10.8 pA ternary complex) occurs (for an expanded illustration of this current trace, see Supplementary Movie 1 and Supplementary Figure 2). c, Position of the 6 abasic residue insert for the template shown in panel a, as T7DNAP atop the pore catalyzes single nucleotide additions that advance the template through the three detectable EBS amplitudes (panels b and d). Assignment of the 8.5, 10, 10.8 pA EBS levels to T7DNAP-DNA complexes in which the primer strand has been extended by eight, nine and ten nucleotides, respectively, was verified using chemically synthesized 3′-H terminated primers corresponding to these extension products that were hybridized to the template in ‘a’. The mean EBS amplitudes and standard deviations for these control complexes are indicated below each cartoon and were based on at least 15 events analyzed using Clampfit software. By comparison, DNA alone gave a current of 6.33±0.56 pA for the same conditions at 80 mV. d, Enlarged view of the region of the current trace in panel b that comprises the three amplitude levels. The red arrows indicate polymerase-catalyzed translocation of the DNA template in the pore as the enzyme advances on the template with each nucleotide addition cycle. Importantly, assignment of these three current values to template positions is rigorously supported by the unique templating G base at position +10 that ensures formation of only one ternary complex in this experiment.
Figure 6
Figure 6. KF replication of individual DNA substrate molecules deprotected and tethered in the nanopore
a, Primer/template substrate used in KF replication experiments. The first G residue at position 35 of the template is shown in blue, and the six abasic residues are shown as red Xs. Sequences at the 5′ end of the template, which include the binding site for the tethering oligomer on the trans side of the nanopore, are not shown. We note that the distance from position n=0 to the abasic insert is 19nt for this template compared to 23nt for the template in Figure 5. Thus the number of base additions needed to bring the abasic insert to the limiting pore constriction (lysine 147 of α-hemolysin) differs. That is, +8 nt in Figure 5 places the abasic insert 14-to-19 nt from the catalytic site giving a current of 8.5 pA; the corresponding position here in Figure 6 is +4nt which places the abasic insert 14- to-19 nt from the catalytic site giving a current of 8.1 pA. b, Cartoons depicting the position of the 6 abasic residue insert in the template shown in panel a, as it is drawn in single nucleotide (5 Å) increments by the KF molecule atop the pore during replication of the template. The IEBS values were measured at 80 mV for each of these complexes by capturing ternary complexes formed with a series of synthetic primer/template substrates corresponding to each single-nucleotide addition to the substrate shown in panel a. The mean amplitude and standard deviation from these experiments is indicated below each cartoon. Each of these values was estimated by measuring the mean amplitude of at least 20 events using Clampfit software and then calculating the mean and standard deviation of those measurements. c, EBS amplitude map at 80 mV for the KF-DNA-dNTP ternary complexes illustrated in panel b. The dashed line indicates IDNA at 80 mV which was 6.61±0.64 pA. d, Representative current trace for a captured molecule in which KF catalyzed the addition of 11 nucleotides (for an expanded illustration of this current trace, see Supplementary Figure 3).

References

    1. Benner S, et al. Sequence-specific detection of individual DNA polymerase complexes in real time using a nanopore. Nat Nanotechnol. 2007;2:718–724. - PMC - PubMed
    1. Cockroft SL, Chu J, Amorin M, Ghadiri MR. A single-molecule nanopore device detects DNA polymerase activity with single-nucleotide resolution. J Am Chem Soc. 2008;130:818–820. - PMC - PubMed
    1. Hurt N, Wang H, Akeson M, Lieberman KR. Specific nucleotide binding and rebinding to individual DNA polymerase complexes captured on a nanopore. J Am Chem Soc. 2009;131:3772–3778. - PMC - PubMed
    1. Wilson NA, et al. Electronic control of DNA polymerase binding and unbinding to single DNA molecules. ACS Nano. 2009;3:995–1003. - PMC - PubMed
    1. Gyarfas B, et al. Mapping the Position of DNA Polymerase-Bound DNA Templates in a Nanopore at 5 A Resolution. ACS Nano. 2009;3:1457–1466. - PubMed

Publication types