. 2010 Dec;27(12):2766-75.
doi: 10.1007/s11095-010-0278-4. Epub 2010 Sep 25.

Differential response of normal (PrEC) and cancerous human prostate cells (PC-3) to phenethyl isothiocyanate-mediated changes in expression of antioxidant defense genes

Affiliations

Differential response of normal (PrEC) and cancerous human prostate cells (PC-3) to phenethyl isothiocyanate-mediated changes in expression of antioxidant defense genes

Anna A Powolny et al. Pharm Res. 2010 Dec.

Abstract

Purpose: The present study was undertaken to test a hypothesis that differential sensitivity of normal and cancerous human prostate cells to prooxidant effect of phenethyl isothiocyanate (PEITC) is determined by altered expression of antioxidant defense genes.

Methods: Prooxidant effect of PEITC was assessed by flow cytometry using a chemical probe and measurement of hydrogen peroxide production. Gene expression was determined by real-time PCR using Human Oxidative Stress and Antioxidant Defense RT(2) Profiler™. Protein expression was determined by Western blotting.

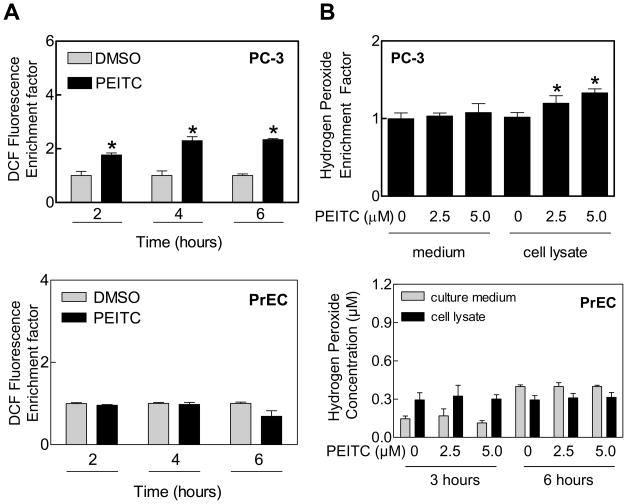
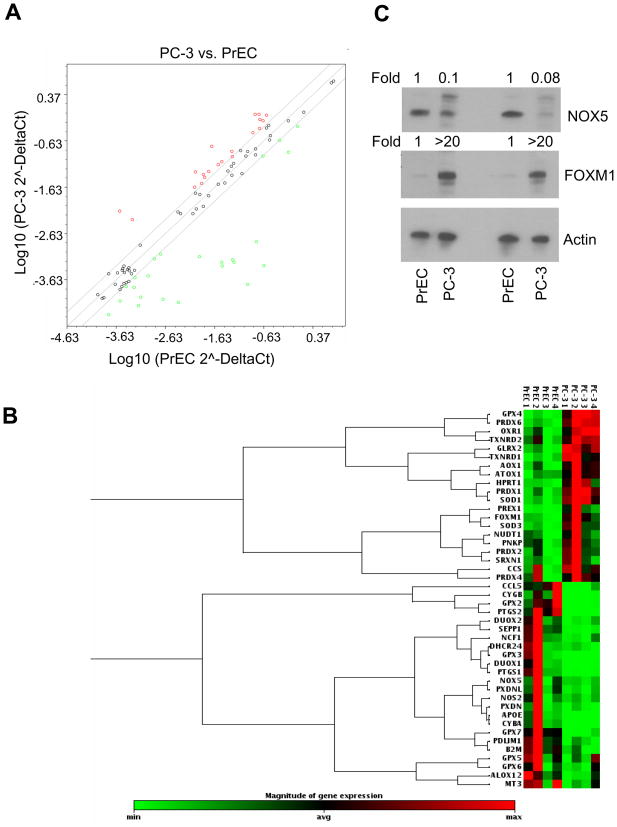
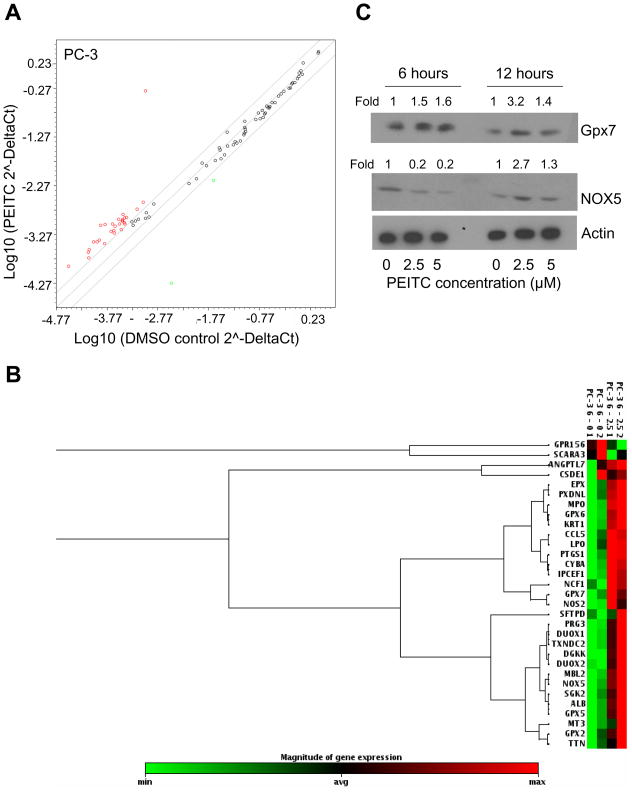
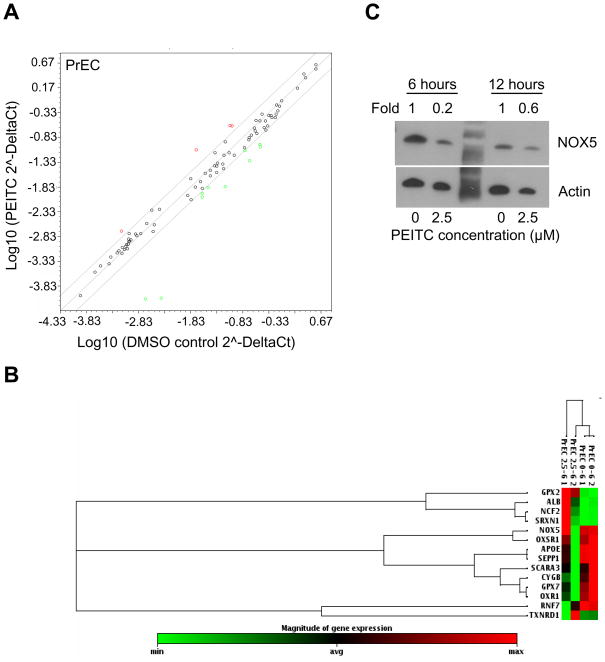
Results: The PEITC treatment resulted in generation of reactive oxygen species and hydrogen peroxide production in PC-3 human prostate cancer cells but not in a representative normal human prostate epithelial cell line (PrEC). Basal oxidative stress-antioxidant defense gene expression signature was strikingly different between PC-3 and PrEC cells. The PEITC treatment (2.5 μM, 6 h) caused up-regulation of 29 genes and down-regulation of 2 genes in PC-3 cells. Conversely, 4 genes were up-regulated, and 10 genes were down-regulated by a similar PEITC treatment in the PrEC cell line.

Conclusions: Differential sensitivity of PC-3 versus PrEC cells to prooxidant effect of PEITC is likely attributable to difference in basal as well as altered expression of antioxidant defense genes.


Figures

Figure 1
Figure 1
Generation of reactive oxygen species by PEITC treatment in PC-3 cells. A) Flow cytometric analysis of DCF fluorescence (a measure of ROS production) in PC-3 and PrEC cells treated with DMSO (control) or 5 μM PEITC for the indicated time periods. B) Hydrogen peroxide production in medium and lysate of PC-3 and PrEC cells treated with the indicated concentrations of PEITC for 6 hour (PC-3) or 3 and 6 hours (PrEC). Data represent mean ±SD (n=3). *Significantly different compared with corresponding DMSO-treated control by Student’s t-test.
Figure 2
Figure 2
Comparative expression of oxidative stress response and antioxidant defense genes in PC-3 and PrEC cells. A) Relative expression of genes involved in oxidative stress response and antioxidant defense between PrEC and PC-3 cells. Genes up- and down-regulated are represented by red and green dots, respectively. Scatter plot shows a log transformation of the relative expression level of each gene between PC-3 and PrEC cells. B) Cluster analysis demonstrating differences in gene expression between PC-3 and PrEC cells. Genes represented in the gene cluster analysis are limited to those whose expression differs between the cells by at least 2-fold. Two independently prepared samples of each cell line in duplicate were used for gene expression profiling (n=4). C) Immunoblotting for NOX5 and FOXM1 using two lysates from PrEC and PC-3 cells. Membranes were stripped and re-probed with anti-actin antibody to ensure equal protein loading.
Figure 3
Figure 3
Effect of PEITC treatment on expression of oxidative stress response and antioxidant defense genes in PC-3 cells. A) Scatter plot shows a log transformation of the relative expression level of each gene between PC-3 cells treated with DMSO (control) and 2.5 μM PEITC for 6 hours. B) Cluster analysis demonstrating differences in gene expression in PC-3 cells in response to PEITC treatment. Cluster analysis shows only those genes which have a minimum of 2-fold change in expression in response to PEITC treatment. The PC-3 cells were treated with DMSO or 2.5 μM PEITC for 6 hours. Data are from duplicate measurements (n=2). C) Immunoblotting for glutathione peroxidase 7 and NOX5 using lysates from PC-3 cells treated with 2.5 and 5 μM PEITC or DMSO (control) for 6 or 12 hours. In order to ensure equal lysate protein loading, membranes were stripped and re-probed with anti-actin antibody. Change in protein level is expressed relative to DMSO-treated control.
Figure 4
Figure 4
Effect of PEITC treatment on expression of oxidative stress response and antioxidant defense genes in PrEC cells. A) Scatter plot shows a log transformation of the relative expression level of each gene between the PrEC cells treated with DMSO and 2.5 μM PEITC for 6 hours. B) Cluster analysis demonstrating differences in gene expression in PrEC cells in response to PEITC treatment. Cluster analysis shows only those genes whose expression was changed by a minimum of 2-fold in response to PEITC treatment. C) Immunoblotting for NOX5 using lysates from PrEC cells treated with DMSO or the indicated concentrations of PEITC for 6 or 12 hour. Membranes was stripped and re-probed with anti-actin antibody to ensure equal protein loading. Change in the protein level is expressed relative to DMSO-treated control.

References

    1. Verhoeven DT, Goldbohm RA, van Poppel G, Verhagen H, van den Brandt PA. Epidemiological studies on brassica vegetables and cancer risk. Cancer Epidemiol Biomarkers Prev. 1996;5:733–48. - PubMed
    1. Ambrosone CB, McCann SE, Freudenheim JL, Marshall JR, Zhang Y, Shields PG. Breast cancer risk in premenopausal women is inversely associated with consumption of broccoli, a source of isothiocyanates, but is not modified by GST genotype. J Nutr. 2004;134:1134–8. - PubMed
    1. Kolonel LN, Hankin JH, Whittemore AS, et al. Vegetables, fruits, legumes and prostate cancer: a multiethnic case-control study. Cancer Epidemiol Biomarkers Prev. 2000;9:795–804. - PubMed
    1. Jemal A, Siegel R, Ward E, Hao Y, Xu J, Thun MJ. Cancer statistics 2009. CA Cancer J Clin. 2009;59:225–249. - PubMed
    1. Fahey JW, Zalcmann AT, Talalay P. The chemical diversity and distribution of glucosinolates and isothiocyanates among plants. Phytochem. 2001;56:5–51. - PubMed

Publication types