

Quantitative assessment of diffusion-weighted MR imaging in patients with primary rectal cancer: correlation with FDG-PET/CT
- PMID: 20872077
- PMCID: PMC3179585
- DOI: 10.1007/s11307-010-0433-7
Quantitative assessment of diffusion-weighted MR imaging in patients with primary rectal cancer: correlation with FDG-PET/CT
Abstract
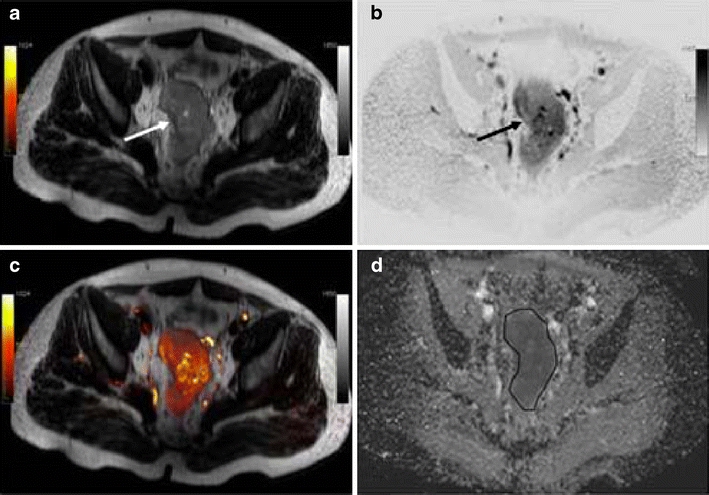
Purpose: The aim of the study was to assess correlations between parameters on diffusion-weighted imaging and 2-deoxy-2-[(18)F]fluoro-D-glucose-positron emission tomography/computed tomography (FDG-PET/CT) in rectal cancer.
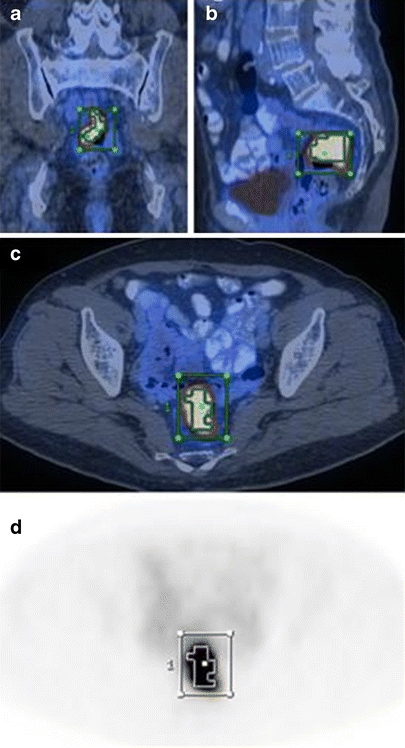
Procedures: Thirty-three consecutive patients with pathologically confirmed rectal adenocarcinoma were included in this study. Apparent diffusion coefficient (ADC) maps were generated to calculate ADC(mean) (average ADC), ADC(min) (lowest ADC), tumor volume, and total diffusivity index (TDI). PET/CT exams were performed within 1 week of magnetic resonance imaging. Standardized uptake values (SUVs) were normalized to the injected FDG dose and body weight. SUV(max) (maximum SUV), SUV(mean) (average SUV), tumor volume, and total lesion glycolysis (TLG) were calculated using a 50% threshold.
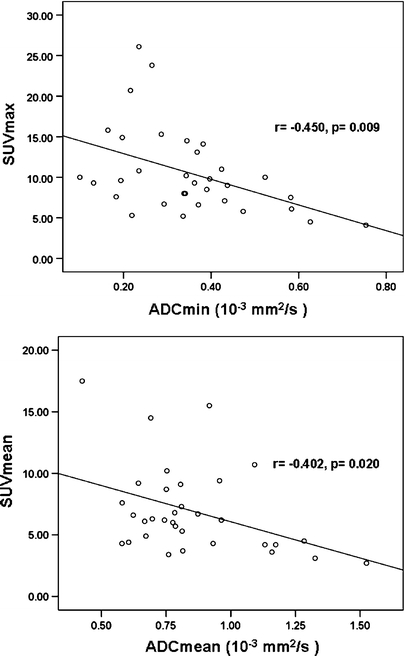
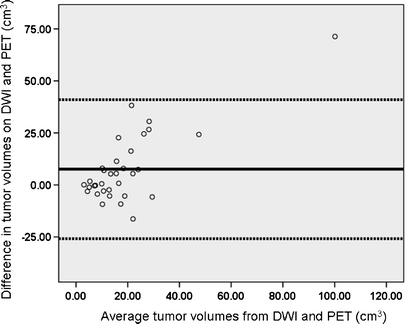
Results: Significant negative correlations were found between ADC(min) and SUV(max) (r = -0.450, p = 0.009), and between ADC(mean) and SUV(mean) (r = -0.402, p = 0.020). A significant positive correlation was found between TDI and TLG (r = 0.634, p < 0.001).
Conclusion: The significant negative correlations between ADC and SUV suggest an association between tumor cellularity and metabolic activity in primary rectal adenocarcinoma.
Figures
Similar articles
-
Correlation of simultaneously acquired diffusion-weighted imaging and 2-deoxy-[18F] fluoro-2-D-glucose positron emission tomography of pulmonary lesions in a dedicated whole-body magnetic resonance/positron emission tomography system.Invest Radiol. 2013 May;48(5):247-55. doi: 10.1097/RLI.0b013e31828d56a1. Invest Radiol. 2013. PMID: 23519008
-
Correlation between apparent diffusion coefficients on diffusion-weighted MRI and standardized uptake value on FDG-PET/CT in pancreatic adenocarcinoma.Acta Radiol. 2015 Sep;56(9):1034-41. doi: 10.1177/0284185114549825. Epub 2014 Sep 29. Acta Radiol. 2015. PMID: 25267921
-
Hybrid [¹⁸F]-FDG PET/MRI including non-Gaussian diffusion-weighted imaging (DWI): preliminary results in non-small cell lung cancer (NSCLC).Eur J Radiol. 2013 Nov;82(11):2055-60. doi: 10.1016/j.ejrad.2013.05.027. Epub 2013 Jul 5. Eur J Radiol. 2013. PMID: 23830904
-
Correlation of apparent diffusion coefficients measured by 3T diffusion-weighted MRI and SUV from FDG PET/CT in primary cervical cancer.Eur J Nucl Med Mol Imaging. 2009 Feb;36(2):200-8. doi: 10.1007/s00259-008-0936-5. Epub 2008 Sep 9. Eur J Nucl Med Mol Imaging. 2009. PMID: 18779960
-
Measurement of apparent diffusion coefficient with simultaneous MR/positron emission tomography in patients with peritoneal carcinomatosis: comparison with 18F-FDG-PET.J Magn Reson Imaging. 2014 Nov;40(5):1121-8. doi: 10.1002/jmri.24497. Epub 2013 Nov 8. J Magn Reson Imaging. 2014. PMID: 24923481
Cited by
-
Pretreatment Apparent Diffusion Coefficient Cannot Predict Histopathological Features and Response to Neoadjuvant Radiochemotherapy in Rectal Cancer: A Meta-Analysis.Dig Dis. 2022;40(1):33-49. doi: 10.1159/000515631. Epub 2021 Mar 4. Dig Dis. 2022. PMID: 33662962 Free PMC article.
-
Assessment of stereotactic radiosurgery treatment response for brain metastases using MRI based diffusion index.Eur J Radiol Open. 2017 Jul 10;4:84-88. doi: 10.1016/j.ejro.2017.06.002. eCollection 2017. Eur J Radiol Open. 2017. PMID: 28725661 Free PMC article.
-
Quantitative assessment of simultaneous F-18 FDG PET/MRI in patients with various types of hepatic tumors: Correlation between glucose metabolism and apparent diffusion coefficient.PLoS One. 2017 Jul 3;12(7):e0180184. doi: 10.1371/journal.pone.0180184. eCollection 2017. PLoS One. 2017. PMID: 28672016 Free PMC article.
-
Multiparametric positron emission tomography/magnetic resonance imaging in nasopharyngeal carcinoma: Correlations between magnetic resonance imaging functional parameters and 18F-fluorodeoxyglucose positron emission tomography imaging biomarkers and their predictive value for treatment failure.Tzu Chi Med J. 2020 Apr 10;33(1):61-69. doi: 10.4103/tcmj.tcmj_4_20. eCollection 2021 Jan-Mar. Tzu Chi Med J. 2020. PMID: 33505880 Free PMC article.
-
Whole lesion histogram analysis of apparent diffusion coefficient predicts therapy response in locally advanced rectal cancer.World J Gastroenterol. 2022 Jun 21;28(23):2609-2624. doi: 10.3748/wjg.v28.i23.2609. World J Gastroenterol. 2022. PMID: 35949349 Free PMC article.
References
-
- Taouli B, Vilgrain V, Dumont E, Daire JL, Fan B, Menu Y. Evaluation of liver diffusion isotropy and characterization of focal hepatic lesions with two single-shot echo-planar MR imaging sequences: prospective study in 66 patients. Radiology. 2003;226:71–78. doi: 10.1148/radiol.2261011904. - DOI - PubMed
MeSH terms
Substances
LinkOut - more resources
Full Text Sources
Medical
