

Anoxia, acidosis, and intergenic interactions selectively regulate methionine sulfoxide reductase transcriptions in mouse embryonic stem cells
- PMID: 20872796
- PMCID: PMC3134303
- DOI: 10.1002/jcb.22876
Anoxia, acidosis, and intergenic interactions selectively regulate methionine sulfoxide reductase transcriptions in mouse embryonic stem cells
Abstract
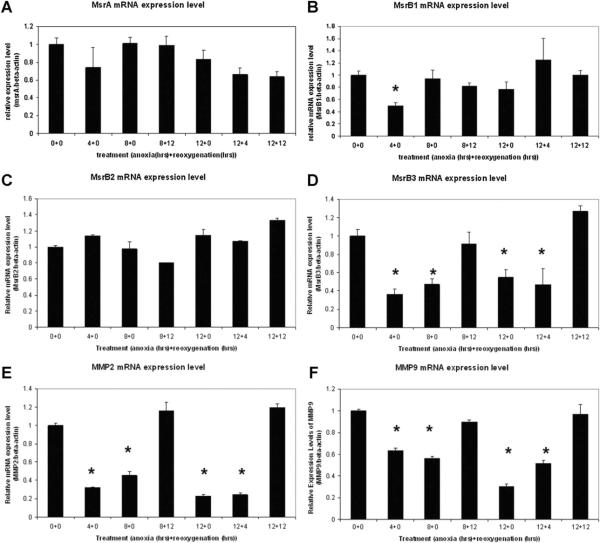
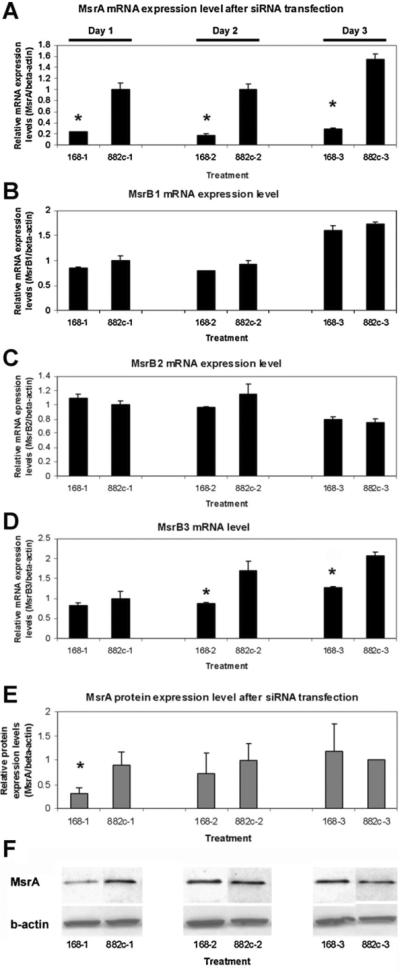
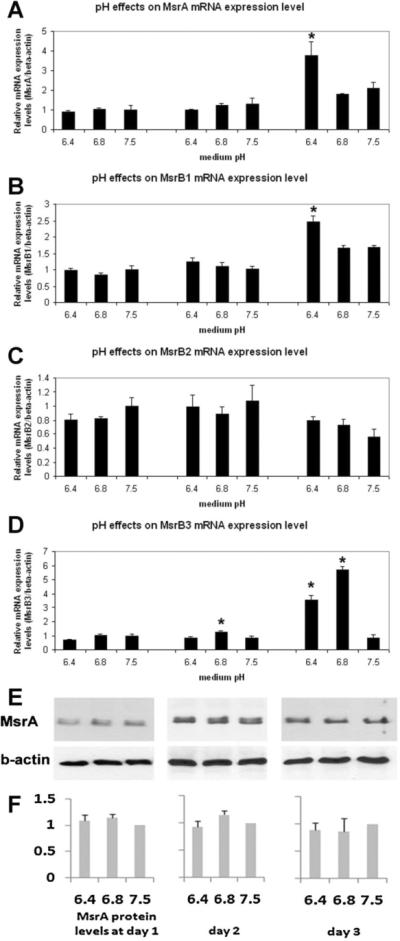
Methionine sulfoxide reductases (Msr) belong to a gene family that contains one MsrA and three MsrBs (MsrB1, MsrB2, and MsrB3). We have identified all four of the genes that are expressed in mouse embryonic stem cell cultures. The vital cellular functions of the Msr family of genes are to protect cells from oxidative damage by enzymatically reducing the oxidized sulfide groups of methionine residues in proteins from the sulfoxide form (--SO) back to sulfide thus restoring normal protein functions as well as reducing intracellular reactive oxygen species (ROS). We have performed studies on the Msr family genes to examine the regulation of gene expression. Our studies using real-time RT-PCR and Western blotting have shown that expression levels of the four Msr family genes are under differential regulation by anoxia/reoxygenation treatment, acidic culture conditions and interactions between MsrA and MsrB. Results from these in vitro experiments suggest that although these genes function as a whole in oxidative stress protection, each one of the Msr genes could be responsive to environmental stimulants differently at the tissue level.
Figures
Similar articles
-
Identification of a truncated form of Methionine Sulfoxide Reductase A expressed in mouse embryonic stem cells.J Biomed Sci. 2011 Jun 22;18(1):46. doi: 10.1186/1423-0127-18-46. J Biomed Sci. 2011. PMID: 21696616 Free PMC article.
-
Methionine sulfoxide reductases B1, B2, and B3 are present in the human lens and confer oxidative stress resistance to lens cells.Invest Ophthalmol Vis Sci. 2005 Jun;46(6):2107-12. doi: 10.1167/iovs.05-0018. Invest Ophthalmol Vis Sci. 2005. PMID: 15914630 Free PMC article.
-
Methionine sulfoxide reductase A (MsrA) protects cultured mouse embryonic stem cells from H2O2-mediated oxidative stress.J Cell Biochem. 2010 Sep 1;111(1):94-103. doi: 10.1002/jcb.22666. J Cell Biochem. 2010. PMID: 20506347 Free PMC article.
-
Methionine sulfoxide reductase (Msr) dysfunction in human brain disease.Free Radic Res. 2019 Dec;53(11-12):1144-1154. doi: 10.1080/10715762.2019.1662899. Epub 2019 Nov 27. Free Radic Res. 2019. PMID: 31775527 Review.
-
Methionine sulfoxide reductases and virulence of bacterial pathogens.Future Microbiol. 2007 Dec;2(6):619-30. doi: 10.2217/17460913.2.6.619. Future Microbiol. 2007. PMID: 18041903 Review.
Cited by
-
Methionine Sulfoxide Reductase B1 Regulates Hepatocellular Carcinoma Cell Proliferation and Invasion via the Mitogen-Activated Protein Kinase Pathway and Epithelial-Mesenchymal Transition.Oxid Med Cell Longev. 2018 May 10;2018:5287971. doi: 10.1155/2018/5287971. eCollection 2018. Oxid Med Cell Longev. 2018. PMID: 29861830 Free PMC article.
-
Increased expression of methionine sulfoxide reductases B3 is associated with poor prognosis in gastric cancer.Oncol Lett. 2019 Jul;18(1):465-471. doi: 10.3892/ol.2019.10318. Epub 2019 May 6. Oncol Lett. 2019. PMID: 31289518 Free PMC article.
-
Methionine sulfoxide reductase A: Structure, function and role in ocular pathology.World J Biol Chem. 2011 Aug 26;2(8):184-92. doi: 10.4331/wjbc.v2.i8.184. World J Biol Chem. 2011. PMID: 21909460 Free PMC article.
References
-
- Cabreiro F, Picot CR, Perichon M, Castel J, Friguet B, Petropoulos I. Overexpression of mitochondrial methionine sulfoxide reductase B2 protects leukemia cells from oxidative stress-induced cell death and protein damage. J Biol Chem. 2008;283(24):16673–16681. - PubMed
-
- Gabbita SP, Aksenov MY, Lovell MA, Markesbery WR. Decrease in peptide methionine sulfoxide reductase in Alzheimer's disease brain. J Neurochem. 1999;73(4):1660–1666. - PubMed
Publication types
MeSH terms
Substances
Grants and funding
LinkOut - more resources
Full Text Sources
