. 2011 Jun;17(6):1373-86.
doi: 10.1002/ibd.21479. Epub 2010 Sep 24.

Colitis locus on chromosome 2 impacting the severity of early-onset disease in mice deficient in GPX1 and GPX2

Affiliations

Colitis locus on chromosome 2 impacting the severity of early-onset disease in mice deficient in GPX1 and GPX2

R Steven Esworthy et al. Inflamm Bowel Dis. 2011 Jun.

Abstract

Background: Genetic background has a profound effect on inflammatory bowel disease. The Gpx1 and Gpx2 double knockout (GPX1/2-DKO) mice on a mixed C57BL/6 (B6) and 129S1/SvimJ (129) background exhibit spontaneous ileocolitis. The DKO mice on a B6 background have mild ileocolitis. We characterized the 129 DKO mice to identify a genetic locus affecting disease severity.

Methods: We backcrossed B6;129 DKO mice to 129 and analyzed for ileocolitis penetrance and severity at N5, N7, and N10. By correlating disease severity with single-nucleotide polymorphism (SNP) markers, we identified a colitis locus.

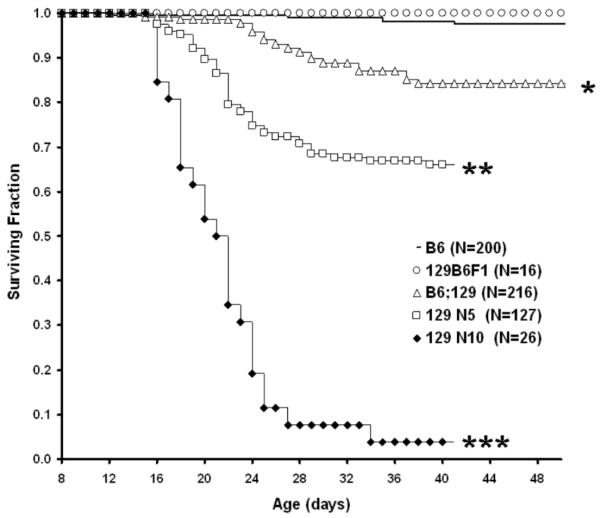
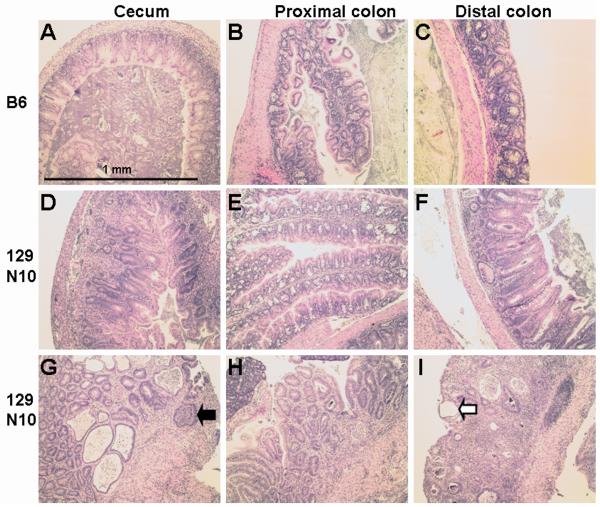
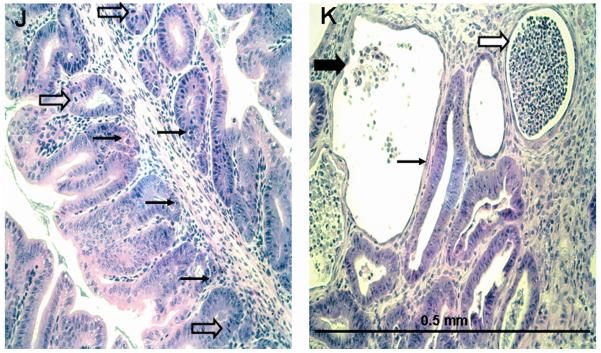
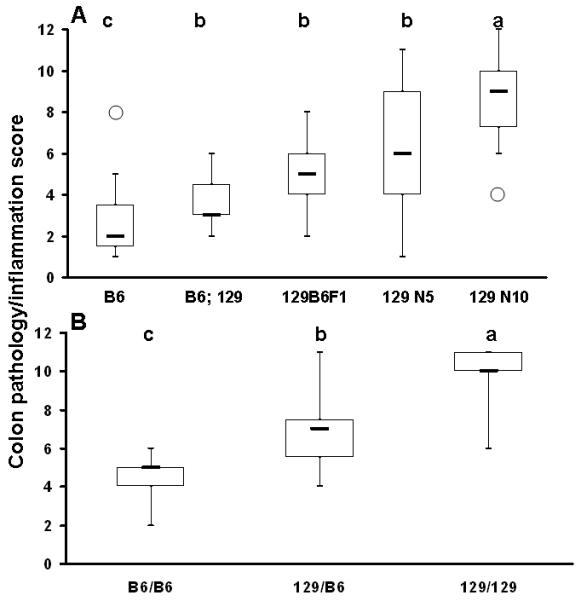
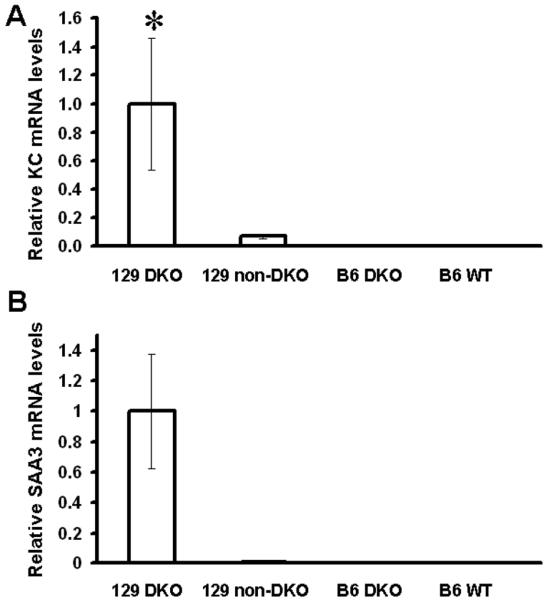
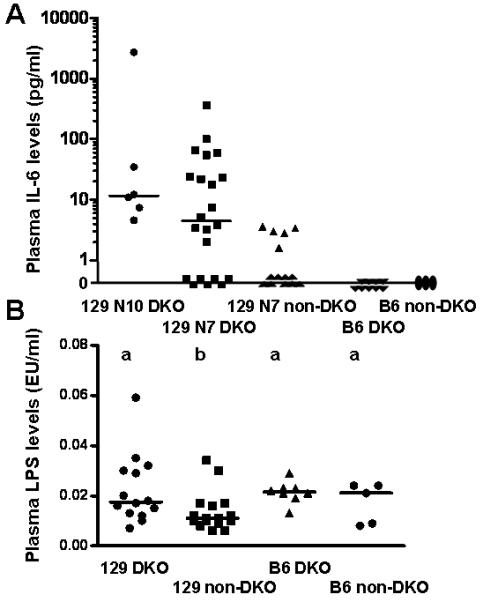
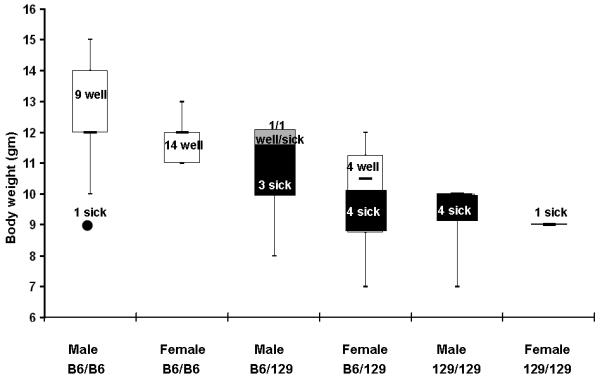
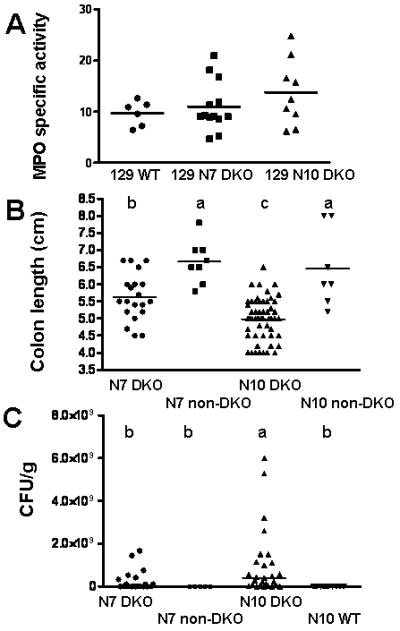
Results: As early as 9 days of age, 129 DKO N5 and N10 mice showed disease signs and morbidity. The N10 DKO mice had the severest colitis with nearly complete penetrance and high morbidity compared with other generations or backgrounds. 129 DKO mice had elevated colonic KC and SAA3 expression, shorter colon length, and cecal E. coli overgrowth compared to B6 DKO mice. Analysis of the B6 loci in 129 N5, N7, and N10 cohorts pointed to a region of chromosome 2: 119 Mbp contributing to mild symptoms.

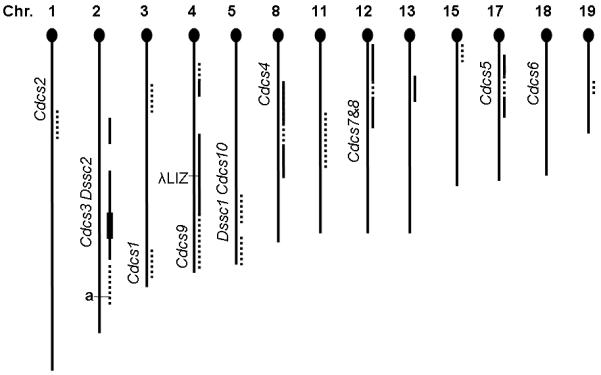
Conclusions: GPX1/2-DKO mice on 129 genetic background have the most aggressive colitis compared to B6;129 and B6 colonies. A B6 locus significantly contributing the resistance resides on chromosome 2: 119 Mbp. This region coincides with cytokine-deficiency-induced colitis susceptibility, Cdcs3, identified in the resistant B6 and sensitive C3H/HeJBir (C3Bir) with IL-10 deficiency. A three-way SNP analysis between 129, B6, and C3Bir locus points the major candidate genes to B2m, Dnajc17, Duox2, Pla2g4b, Pla2g4e, Pla2g4f and Slc30a4.


Figures

Figure 1
Figure 1
Kaplan-Meier plot of GPX1/2-DKO mouse morbidity for different genetic backgrounds from 8 days of age. All mice were derived from breeders on LabDiet (9-10% fat). Numbers of mice in cohort are in parenthesis after each strain. Mouse colonies tested include B6, B6;129 mixed, 129B6F1, 129 N5 and 129 N10 (at backcross-generation 5 and 10, respectively). All comparisons between colonies are significantly different (log-rank P<0.0001, shown by symbols: *, **, ***) except B6 vs. 129B6F1.
Figure 2
Figure 2
Histology of the cecum, proximal and distal colon of B6 and 129 N10 GPX1/2-DKO mice. 2A. B6 DKO mice have very mild pathology in the cecum, proximal and distal colon as shown in Panels A, B and C, respectively. B6 DKO colon has sub-inflammatory disease with mucin depletion and high levels of apoptosis and mitosis in the glands. A representative 129 N10 DKO mouse with medium and severe inflammation is shown in Panels D-F and G-I, respectively, at 22 days of age (peak of colitis). Moderate pathology is found in some proximal colons of 129 DKO mice (Panel E). The 129 DKO colon often has neutrophil infiltration (black arrow), extensive exfoliation of crypt epithelial cells with epithelial restitution (white arrow), and a combination of crypt destruction and distortion. 2B. Detailed pathology of 129 DKO distal colon. Panel J shows sub-inflammatory pathology in a 129 DKO mouse (adjacent to the area in panel F). Distorted, mucin-depleted glands are shown with a juxtaposition of epithelial apoptosis (thin arrows) and mitosis (block arrows). Panel K shows an active abscess (wide white arrow), and a post-inflamed gland with remnants of exfoliated epithelial cells (wide black arrow) and compensating restitution (thin arrow) in a region of intense pathology. Typical of such regions, apoptosis and mitosis are no longer prominent in the adjacent less damaged glands.
Figure 2
Figure 2
Histology of the cecum, proximal and distal colon of B6 and 129 N10 GPX1/2-DKO mice. 2A. B6 DKO mice have very mild pathology in the cecum, proximal and distal colon as shown in Panels A, B and C, respectively. B6 DKO colon has sub-inflammatory disease with mucin depletion and high levels of apoptosis and mitosis in the glands. A representative 129 N10 DKO mouse with medium and severe inflammation is shown in Panels D-F and G-I, respectively, at 22 days of age (peak of colitis). Moderate pathology is found in some proximal colons of 129 DKO mice (Panel E). The 129 DKO colon often has neutrophil infiltration (black arrow), extensive exfoliation of crypt epithelial cells with epithelial restitution (white arrow), and a combination of crypt destruction and distortion. 2B. Detailed pathology of 129 DKO distal colon. Panel J shows sub-inflammatory pathology in a 129 DKO mouse (adjacent to the area in panel F). Distorted, mucin-depleted glands are shown with a juxtaposition of epithelial apoptosis (thin arrows) and mitosis (block arrows). Panel K shows an active abscess (wide white arrow), and a post-inflamed gland with remnants of exfoliated epithelial cells (wide black arrow) and compensating restitution (thin arrow) in a region of intense pathology. Typical of such regions, apoptosis and mitosis are no longer prominent in the adjacent less damaged glands.
Figure 3
Figure 3
Box and whisker plot of colon inflammation/pathology scores of 22-day-old GPX1/2-DKO mice of different genetic backgrounds. Panel A. Colon scores analyzed in different DKO colonies. The open circles represent single outliers. The thick-horizontal bar is the median score. The number of mice studied in each colony is 15 for B6, 6 for B6;129, 18 for 129B6F1, 60 for 129 N5, and 18 for 129 N10 DKO. The letter shows difference in the median colitis scores, in the order of a>b>c., when α= 0.05. Panel B. Colon inflammation/pathology score analyzed in 129 N5-N7 DKO mice stratified for B6 vs. 129 alleles on Chromosome 2: 118-119 Mbp (B6/B6, B6/129 and 129/129). The number of mice studied in each group is 13 for 129 N5 B6/B6, 14 for 129 N5 B6/129 and 6 for 129/129. The median colitis scores that differ are shown as a>b>c. The score of 129 N5 B6/B6 is higher than B6 colony, and the score of 129 N5 129/129 is significantly greater than 129 N10.
Figure 4
Figure 4
Relative mRNA levels of KC and SAA3 in mouse colon normalized against β-actin mRNA. Panel A shows mRNA levels of KC and Panel B shows mRNA levels of SAA3. The number of mice analyzed are five 129 GPX1/2-DKO, four 129 heterozygotes, four B6 GPX1/2-DKO, and two B6 WT. Error bars are standard errors of the means. A * symbol indicates significant difference from other groups.
Figure 5
Figure 5
Scatter plots of plasma IL6 and LPS levels. Panel A. Plasma IL-6 levels from GPX1/2-DKO mice at peak of inflammation, i.e. 22-day-old 129 N7 and N10 mice and 50-day-old B6, as well as age-matched non-DKO controls. The number of mice in each group is: 6 for 129 N10 DKO, 22 for 129 N7 DKO, 14 for N7 non-DKO, 9 for B6 DKO and 3 for B6 non-DKO. No set is significantly different from the others. Panel B. Plasma LPS levels detected for the same groups. The levels in the 129 GPX1/2-DKO group are significantly greater than the heterozygous 129 mice but not the B6 groups (P=0.033, t-test). The means that differ are shown as a>b. The Y-axis is Endotoxin Unit/ml, which is generally converted to LPS concentration as 1 EU=100 pg LPS/ml. In both panels, the bars indicate the medians, and each symbol represents a mouse.
Figure 6
Figure 6
Distribution and incidence of B6 alleles in the 129 N5 cohort, represented by 10 offspring, sampling 5 breeder females and 3 breeder males in comparison with colitogenic loci detected in 2 other studies (complete data in Supplemental Table 1). Chromosomes are listed in order by number and oriented with the telomeric centromere (= 0 Mbp) at the top. The dashed or solid lines to the right of the chromosome stick map indicate loci where B6 alleles were detected in the 129 N5 cohort. Loci with low representation of B6 alleles (1-4 mice; almost all heterozygous) are shown by dashes, and those heavily represented sites (5 or more; some homozygous B6 alleles) shown by solid lines. The left side of the stick map is marked with the location of Cdcs (Cytokine-deficiency-induced colitis susceptibility) and Dssc (Dextran-sodium-sulfate colitis) loci along with the non-agouti gene and the λLIZ transgene. The chromosome 2 B6 loci (solid line) in 129 N5 were detected in 7-8 mice with 1-4 homozygous B6 (4 at 119 Mbp, thickened line). This analysis was based on the GWAS performed on the first set of 129 N5 mice (Supplemental Table 1), thus did not include the new loci on Chromosome 1 and 3 identified in 129 N7 mice (Supplemental Table 2).
Figure 7
Figure 7
Stratification of the mouse health status, body weight and the genotype at Gdac locus. Forty-two 129 N5 DKO mice were checked for symptoms of wet tail/diarrhea, perianal alopecia, perianal ulceration and lethargy from 8-22 days of age and weighed near 22 days of age. Mice were grouped by the genotype at chromosome 2: 119 Mbp, Gdac locus. In each group, mice were characterized either sick (black portion of the box and whisker plot, N=12) or well (white portion of the plot, N=28). The gray portion of male B6/129 box indicates one well and one sick mouse at 12 gm. Sick mice had consecutive days of symptoms and a median body weight of 9.5 gm (range 7-12 gm, no outliers). Well mice had one or at most two days of intermittent symptoms and a median body weight of 12 gm (range 11-15 gm, one outlier at 9 gm: 1.5X>IQR). Due designation as an outlier by virtue of low body weight, one male B6/B6 mouse was re-classified as sick for association analysis (black circle). The designations by health status and weight corresponded to colon inflammation/pathology scores shown in Fig. 3B.
Figure 8
Figure 8
Scatter plots of subcongenic N7 with N10 129 GPX1/2-DKO mice. Panel A. Specific activity of myeloperoxidase (MPO) in the mid-colon sections of 129 mice. Each symbol represents a mouse for all panels. The number of mouse in each group is 6 for WT, 13 for N7 DKO and 9 for N10 DKO. The horizontal line is the mean. Although the mean for each group is in the order of N10 DKO > N7 DKO > WT, this difference is not statistically significant. Panel B. Total colon length measured in N7 and N10 129 mice. The bar represents the mean. The number of mice in each group is 20 for N7 DKO (incross-generation 3-5), 8 for N7 non-DKO which are sibs of DKO, 54 for N10 DKO and 7 for N10 non-DKO. All mice were on AIN diet and analyzed at 22 days of age or morbidity. The median colon length that differs is shown as a>b>c (P≤ 0.03). Panel C. Colony forming unit of E. coli cultured from the cecum of 129 mice. The bacterial counts were determined by the number of colony forming unit (CFU) per gm of cecal content in 129 strain mice fed AIN diet. The number of mice in each group is 20 for N7 DKO, 5 for N7 non-DKO, 27 for N10 DKO and 12 for N10 WT. The horizontal bar represents the median. The groups that differ are shown as a>b (P≤ 0.03, unpaired t test with Welch’s correction).

Similar articles

Cited by

References

    1. Neish AS, Gewirtz AT, Zeng H, et al. Prokaryotic regulation of epithelial responses by inhibition of IkappaB-alpha ubiquitination. Science. 2000;289:1560–1563. - PubMed
    1. Vaishnava S, Behrendt CL, Ismail AS, et al. Paneth cells directly sense gut commensals and maintain homeostasis at the intestinal host-microbial interface. Proc Natl Acad Sci U S A. 2008;105:20858–20863. - PMC - PubMed
    1. Slack E, Hapfelmeier S, Stecher B, et al. Innate and adaptive immunity cooperate flexibly to maintain host-microbiota mutualism. Science. 2009;325:617–620. - PMC - PubMed
    1. Esworthy RS, Aranda R, Martin MG, et al. Mice with combined disruption of Gpx1 and Gpx2 genes have colitis. Am J Physiol Gastrointest Liver Physiol. 2001;281:G848–855. - PubMed
    1. Esworthy RS, Swiderek KM, Ho YS, et al. Selenium-dependent glutathione peroxidase-GI is a major glutathione peroxidase activity in the mucosal epithelium of rodent intestine. Biochim Biophys Acta. 1998;1381:213–226. - PubMed

Publication types