. 2010 Oct 20;132(41):14577-89.
doi: 10.1021/ja105852y.

Protein flexibility and conformational entropy in ligand design targeting the carbohydrate recognition domain of galectin-3

Affiliations
Free PMC article

Protein flexibility and conformational entropy in ligand design targeting the carbohydrate recognition domain of galectin-3

Carl Diehl et al. J Am Chem Soc. .
Free PMC article

Abstract

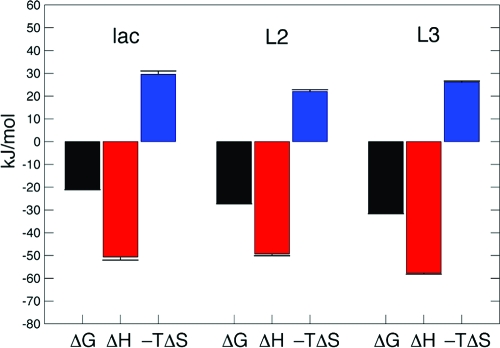
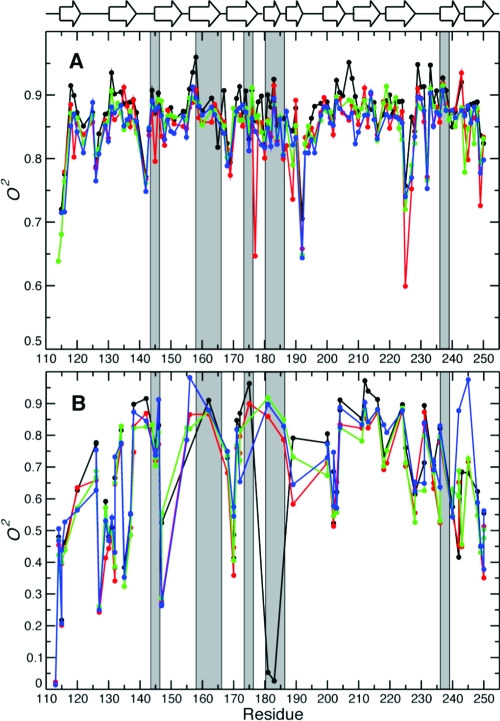
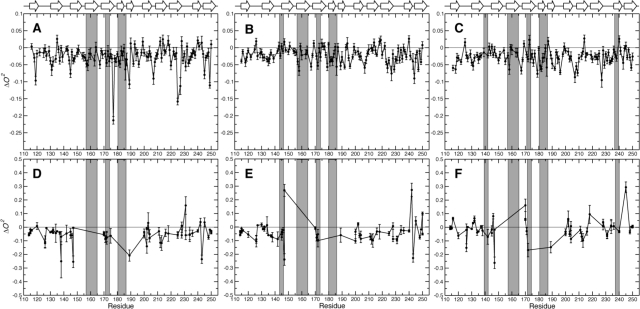
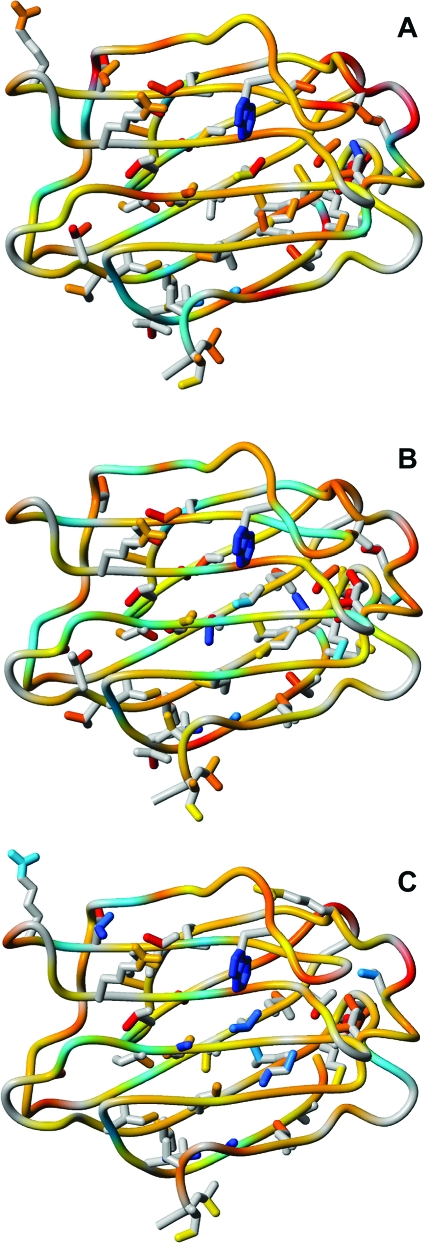
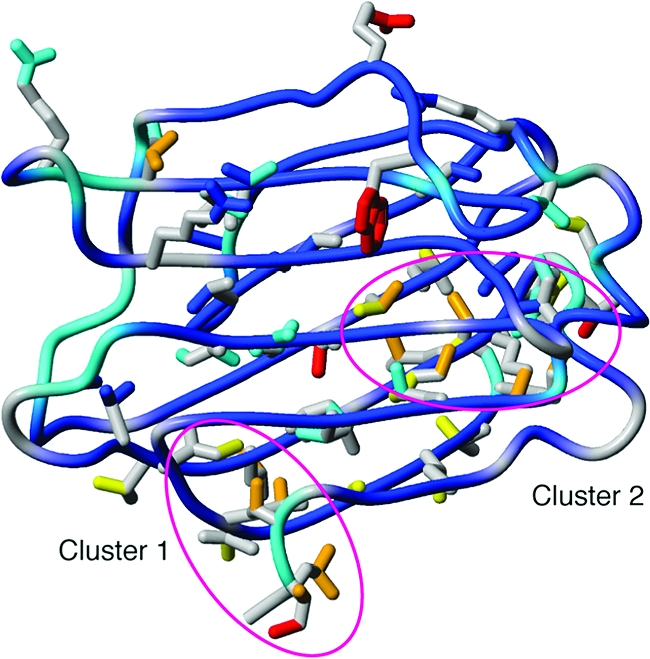
Rational drug design is predicated on knowledge of the three-dimensional structure of the protein-ligand complex and the thermodynamics of ligand binding. Despite the fundamental importance of both enthalpy and entropy in driving ligand binding, the role of conformational entropy is rarely addressed in drug design. In this work, we have probed the conformational entropy and its relative contribution to the free energy of ligand binding to the carbohydrate recognition domain of galectin-3. Using a combination of NMR spectroscopy, isothermal titration calorimetry, and X-ray crystallography, we characterized the binding of three ligands with dissociation constants ranging over 2 orders of magnitude. (15)N and (2)H spin relaxation measurements showed that the protein backbone and side chains respond to ligand binding by increased conformational fluctuations, on average, that differ among the three ligand-bound states. Variability in the response to ligand binding is prominent in the hydrophobic core, where a distal cluster of methyl groups becomes more rigid, whereas methyl groups closer to the binding site become more flexible. The results reveal an intricate interplay between structure and conformational fluctuations in the different complexes that fine-tunes the affinity. The estimated change in conformational entropy is comparable in magnitude to the binding enthalpy, demonstrating that it contributes favorably and significantly to ligand binding. We speculate that the relatively weak inherent protein-carbohydrate interactions and limited hydrophobic effect associated with oligosaccharide binding might have exerted evolutionary pressure on carbohydrate-binding proteins to increase the affinity by means of conformational entropy.


Figures

Figure 1
Figure 1
Crystal structures of Gal3C complexed with lactose (red; PDB entry 2nn8(96)), ligand L2 (green; PDB entry 2xg3), and ligand L3 (blue; PDB entry 1kjr(39)). Side chains of residues that are within 5 Å of the ligands are shown in the stick representation using the same color code as for the ligands. Ligand-binding subsites A, B, C, and D are indicated (see the text for details).
Chart 1
Chart 1. Chemical Structures of the Three Ligands: Lactose (lac), 3′-Benzamido-N-acetyllactosamine (L2), and 3′-(4-Methoxy-2,3,5,6-tetrafluorobenzamido)-N-acetyllactosamine (L3)
Figure 2
Figure 2
Chemical shift differences between apo-Gal3C and the ligand-bound complexes. Δδ is plotted vs residue number for (A) Δδ(lac−apo), (B) Δδ(L2−apo), and (C) Δδ(L3−apo). Secondary structure elements are indicated at the top of the graph. Residues within 5 Å of the ligand are highlighted by gray bars.
Figure 3
Figure 3
Enthalpy of ligand binding to Gal3C. ITC data characterizing complex formation between Gal3C and (A, D) lactose, (B, E) L2, and (C, F) L3 are shown. Panels (A−C) present the experimental ITC data and panels (D−F) the extracted heats of binding, ΔQ, as a function of added ligand together with the fitted binding curves. The temperature was 301 K.
Figure 4
Figure 4
Comparison of the binding thermodynamics of Gal3C complexes at T = 301 K: (left) lac−Gal3C, (center) L2−Gal3C, and (right) L3−Gal3C. The free energies of binding, ΔG°, were determined using Kd values from the titration curves (see Figure 3), after which the equation −TΔS° = ΔG° − ΔH° was used. Legend: black, ΔG°; red, ΔH°; blue, −TΔS°. Error bars indicate one standard deviation.
Figure 5
Figure 5
Order parameters describing the probability distribution of bond-vector orientations in Gal3C: (A) backbone amide order parameters; (B) side-chain order parameters for arginine and tryptophan 15N and methyl 2H. Legend: black, apo-Gal3C; red, lac−Gal3C; green, L2−Gal3C; blue, L3−Gal3C. Secondary structure elements are indicated at the top of the graph. Residues within 5 Å of any of the ligands are highlighted by gray bars. For clarity, error bars are not shown. The average error (one standard deviation) was ±0.07 and was relatively uniform throughout the protein. See Table S3 in the Supporting Information for a complete list of fitted model-free parameters and estimated errors.
Figure 6
Figure 6
Difference between the order parameters of the ligand-bound states and apo-Gal3C plotted vs residue number: (A−C) backbone H−N order parameters, (D−F) side-chain methyl axis order parameters; (A, D) ΔO2(lac−apo), (B, E) ΔO2(L2−apo), (C, F) ΔO2(L3−apo). Secondary structure elements are indicated at the top of the graph. Residues within 5 Å of the ligand are highlighted by gray bars. Error bars indicate one standard deviation.
Figure 7
Figure 7
Difference between the order parameters of the ligand-bound states and apo-Gal3C color-coded onto the corresponding ligand-bound structures: (A) ΔO2(lac−apo); (B) ΔO2(L2−apo); (C) ΔO2(L3−apo). The color code ranges from cyan to blue (0 < ΔO2 ≤ +1; increase in O2 upon binding) and yellow to red (0 > ΔO2 ≥ −1; decrease in O2 upon binding). Side chains are shown only for those residues with |ΔO2| > 1 standard deviation.
Figure 8
Figure 8
Backbone and side-chain order parameters of apo-Gal3C color-coded onto the structure. O2 values for methyl 2H and arginine and tryptophan 15N are color coded as follows: blue (1 ≤ O2 < 0.85); cyan (0.85 < O2 ≤ 0.7); yellow (0.7 < O2 ≤ 0.55); orange (0.55 < O2 ≤ 0.4); red (O2 < 0.4). Side chains are shown only for residues for which O2 could be measured. Magenta ellipsoids indicate methyl clusters 1 and 2 (see the text for details).

References

    1. Freire E. Drug Discovery Today 2008, 13, 869. - PMC - PubMed
    1. Chaires J. B. Annu. Rev. Biophys. 2008, 37, 135. - PubMed
    1. Zhou H. X.; Gilson M. K. Chem. Rev. 2009, 109, 4092. - PMC - PubMed
    1. Leavitt S.; Freire E. Curr. Opin. Struct. Biol. 2001, 11, 560. - PubMed
    1. Olsson T. S. G.; Williams M. A.; Pitt W. R.; Ladbury J. E. J. Mol. Biol. 2008, 384, 1002. - PubMed

Publication types