

A randomized trial of extended telephone-based continuing care for alcohol dependence: within-treatment substance use outcomes
- PMID: 20873894
- PMCID: PMC3082847
- DOI: 10.1037/a0020700
A randomized trial of extended telephone-based continuing care for alcohol dependence: within-treatment substance use outcomes
Abstract
Objective: The study tested whether adding up to 18 months of telephone continuing care, either as monitoring and feedback (TM) or longer contacts that included counseling (TMC), to intensive outpatient programs (IOPs) improved outcomes for alcohol-dependent patients.
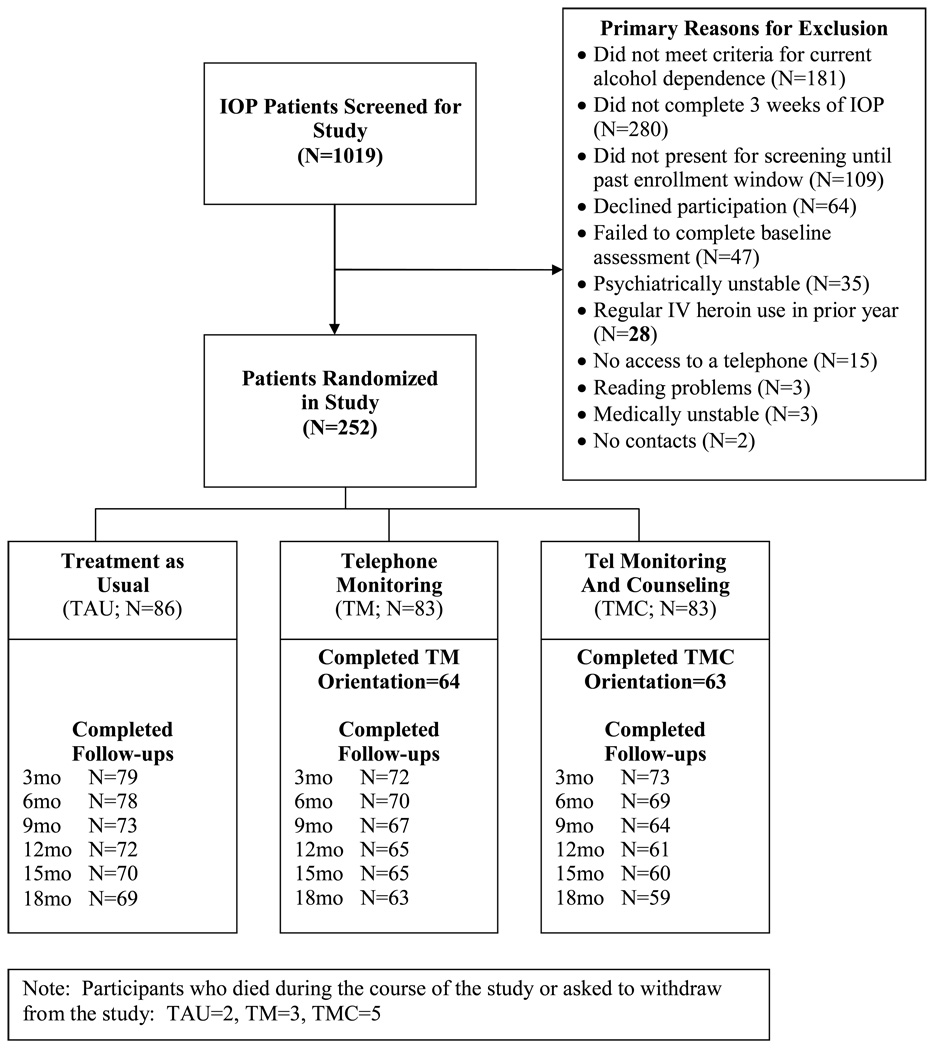
Method: Participants (N = 252) who completed 3 weeks of IOP were randomized to up to 36 sessions of TM (M = 11.5 sessions), TMC (M = 9.1 sessions), or IOP only (treatment as usual [TAU]). Quarterly assessment of alcohol use (79.9% assessed at 18 months) was corroborated with available collateral reports (N = 63 at 12 months). Participants with cocaine dependence (N = 199) also provided urine samples.
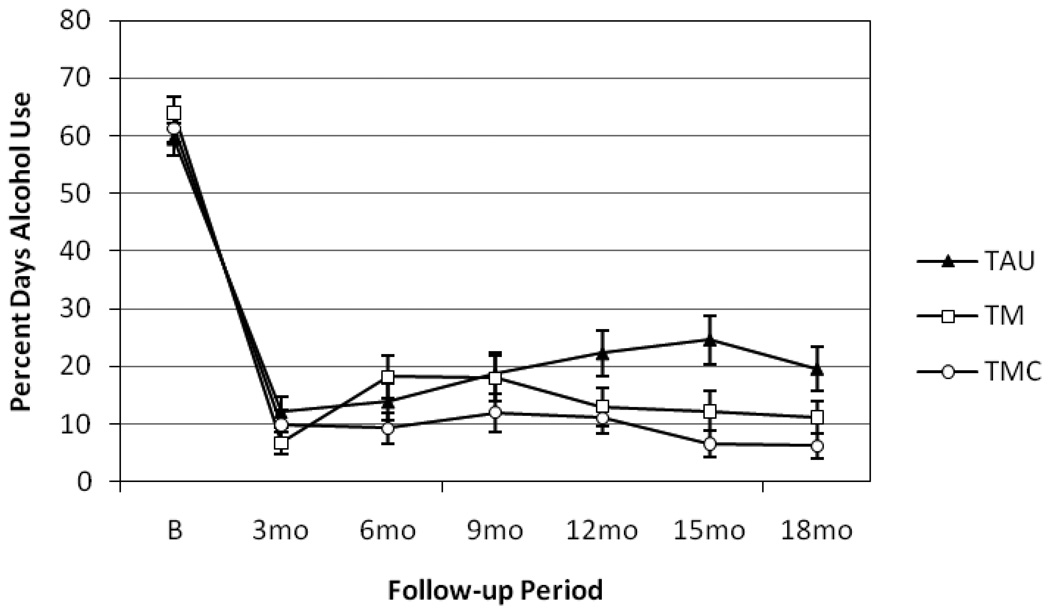
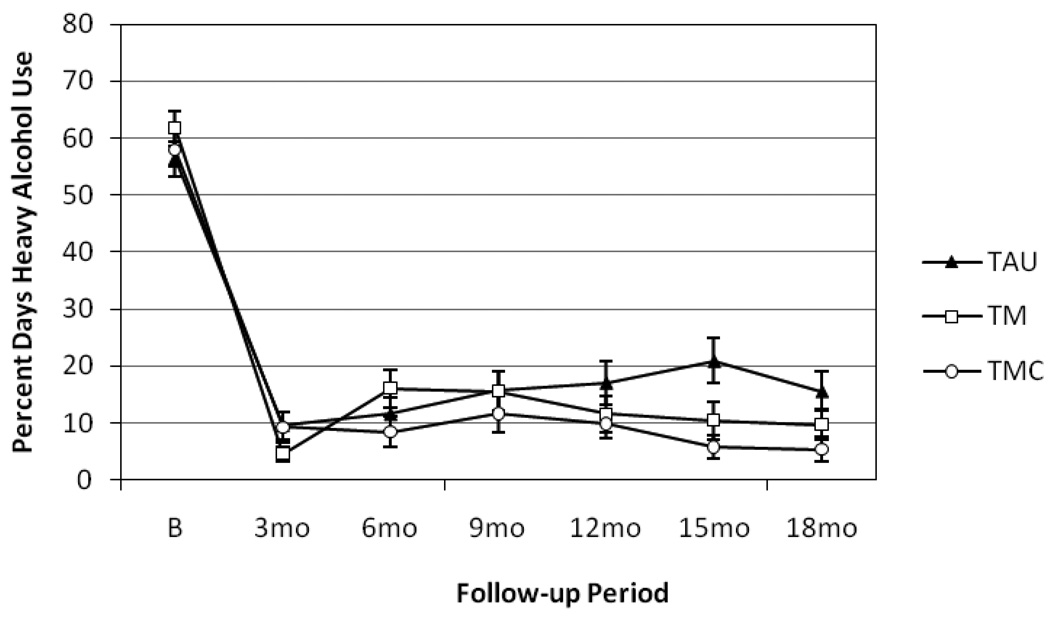
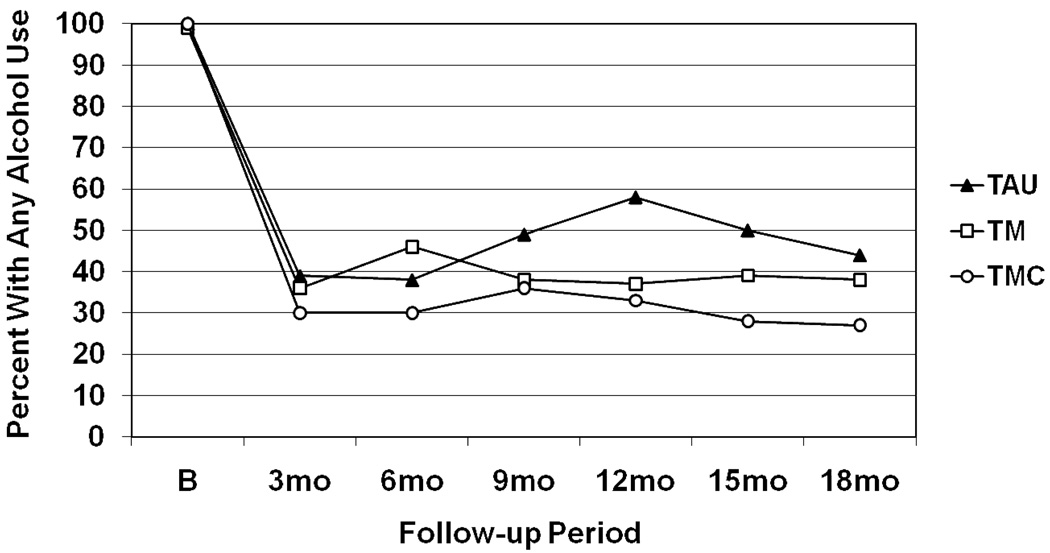
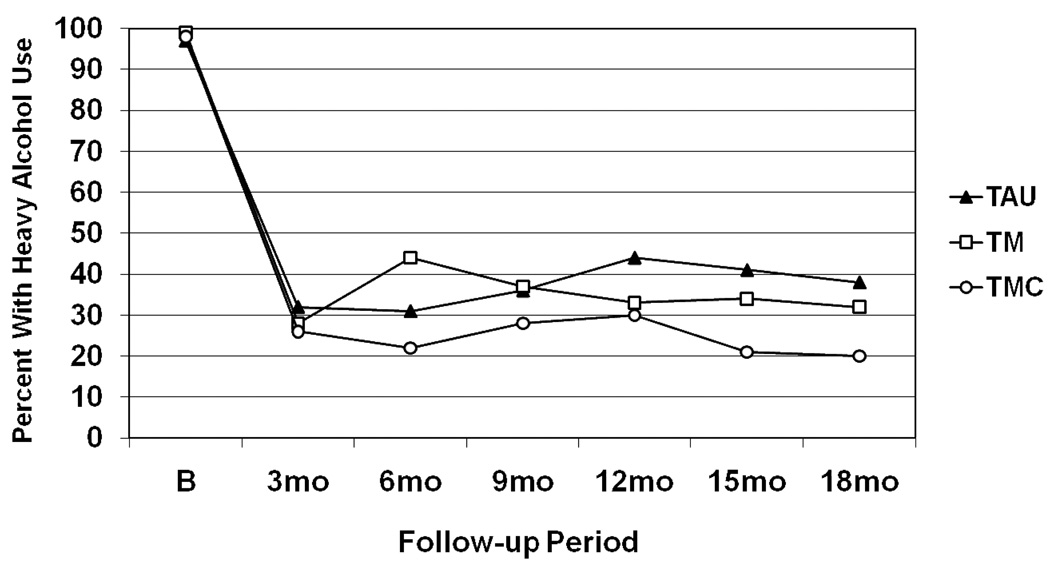
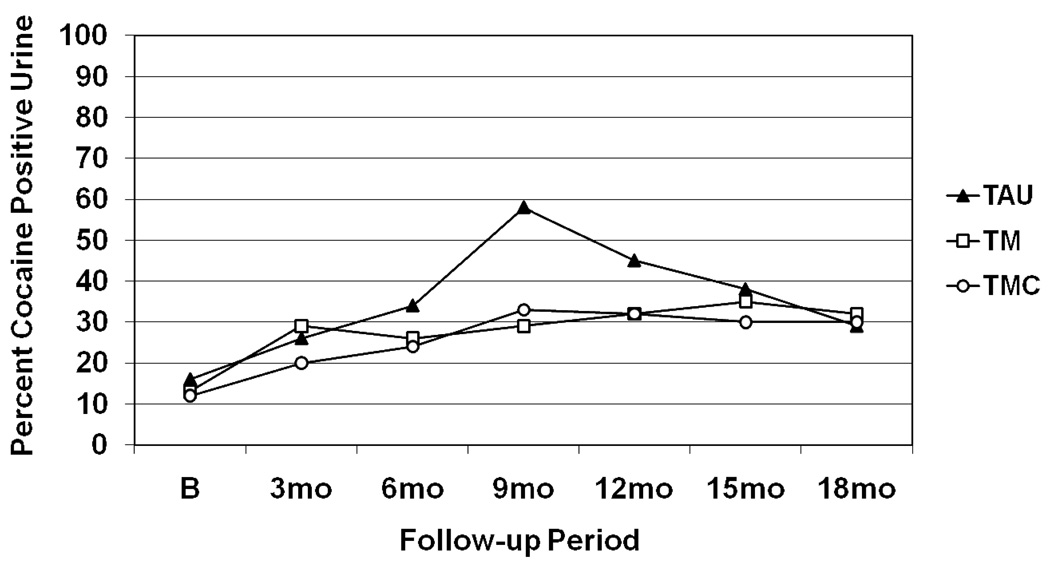
Results: Main effects favored TMC over TAU on any alcohol use (odds ratio [OR] = 1.88, CI [1.13, 3.14]) and any heavy alcohol use (OR = 1.74, CI [1.03, 2.94]). TMC produced fewer days of alcohol use during Months 10-18 and heavy alcohol use during Months 13-18 than TAU (ds = 0.46-0.65). TMC also produced fewer days of any alcohol use and heavy alcohol use than TM during Months 4-6 (ds = 0.39 and 0.43). TM produced lower percent days alcohol use than TAU during Months 10-12 and 13-15 (ds = 0.41 and 0.39). There were no treatment effects on rates of cocaine-positive urines.
Conclusions: Adding telephone continuing care to IOP improved alcohol use outcomes relative to IOP alone. Conversely, shorter calls that provided monitoring and feedback but no counseling generally did not improve outcomes over IOP.
(c) 2010 APA, all rights reserved.
Figures
References
-
- Anglin MD, Hser Y-I, Grella CE. Drug addiction and treatment careers among clients in the Drug Abuse Treatment Outcome Study (DATOS) Psychology of Addictive behavior. 1997;11:308–323.
-
- Babor TF, Steinberg K, Anton R, Del Boca F. Talk is cheap: Measuring drinking outcomes in clinical trials. Journal of Studies on Alcohol. 2000;61:55–63. - PubMed
-
- Carroll KM, Nich C, Sifry RL, Nuro KF, Frankforter TL, Ball SA, Fenton L, Rounsaville BJ. A general system for evaluating therapist adherence and competence in psychotherapy research in the addictions. Drug and Alcohol Dependence. 2000;57:225–238. - PubMed
-
- Clifford PR, Maisto SA, Davis CM. Alcohol treatment research assessment exposure reactivity effects: part 1. Alcohol use and related consequences. Journal of Studies on Alcohol and Drugs. 2007;68:519–528. - PubMed
-
- Coviello DM, Zanis DA, Wesnoski SA, Alterman AI. The effectiveness of outreach case management in re-enrolling discharged methadone patients. Drug and Alcohol Dependence. 2006;85:56–65. - PubMed
