Heart irradiation as a risk factor for radiation pneumonitis
- PMID: 20874426
- PMCID: PMC4041523
- DOI: 10.3109/0284186X.2010.521192
Heart irradiation as a risk factor for radiation pneumonitis
Abstract
Purpose: to investigate the potential role of incidental heart irradiation on the risk of radiation pneumonitis (RP) for patients receiving definitive radiation therapy for non-small-cell lung cancer (NSCLC).
Material and methods: two hundred and nine patient datasets were available for this study. Heart and lung dose-volume parameters were extracted for modeling, based on Monte Carlo-based heterogeneity corrected dose distributions. Clinical variables tested included age, gender, chemotherapy, pre-treatment weight-loss, performance status, and smoking history. The risk of RP was modeled using logistic regression.
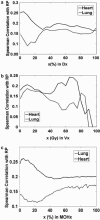
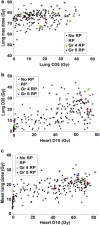
Results: the most significant univariate variables were heart related, such as heart heart V65 (percent volume receiving at least 65 Gy) (Spearman Rs = 0.245, p < 0.001). The best-performing logistic regression model included heart D10 (minimum dose to the hottest 10% of the heart), lung D35, and maximum lung dose (Spearman Rs = 0.268, p < 0.0001). When classified by predicted risk, the RP incidence ratio between the most and least risky 1/3 of treatments was 4.8. The improvement in risk modeling using lung and heart variables was better than using lung variables alone.
Conclusions: these results suggest a previously unsuspected role of heart irradiation in many cases of RP.
Figures


References
-
- Claude L, Perol D, Ginestet C, Falchero L, Arpin D, Vincent M, et al. A prospective study on radiation pneumonitis following conformal radiation therapy in non-small-cell lung cancer: Clinical and dosimetric factors analysis. Radiother Oncol. 2004;71:175–81. - PubMed
-
- Fay M, Tan A, Fisher R, Mac Manus M, Wirth A, Ball D. Dose-volume histogram analysis as predictor of radiation pneumonitis in primary lung cancer patients treated with radiotherapy. Int J Radiat Oncol Biol Phys. 2005;61:1355–63. - PubMed
-
- Graham MV, Purdy JA, Emami B, Harms W, Bosch W, Lockett MA, et al. Clinical dose-volume histogram analysis for pneumonitis after 3D treatment for non-small cell lung cancer (NSCLC). Int J Radiat Oncol Biol Phys. 1999;45:323–9. - PubMed
-
- Hope AJ, Lindsay PE, El Naqa I, Alaly JR, Vicic M, Bradley JD, et al. Modeling radiation pneumonitis risk with clinical, dosimetric, and spatial parameters. Int J Radiat Oncol Biol Phys. 2006;65:112–24. - PubMed
-
- Jenkins P, D'Amico K, Benstead K, Elyan S. Radiation pneumonitis following treatment of non-small-cell lung cancer with continuous hyperfractionated accelerated radiotherapy (CHART). Int J Radiat Oncol Biol Phys. 2003;56:360–6. - PubMed
Publication types
MeSH terms
Grants and funding
LinkOut - more resources
Full Text Sources
Medical
