. 2010 Dec;101(12):2561-9.
doi: 10.1111/j.1349-7006.2010.01733.x. Epub 2010 Sep 28.

RNAi-mediated CD73 suppression induces apoptosis and cell-cycle arrest in human breast cancer cells

Affiliations

RNAi-mediated CD73 suppression induces apoptosis and cell-cycle arrest in human breast cancer cells

Xiuling Zhi et al. Cancer Sci. 2010 Dec.

Abstract

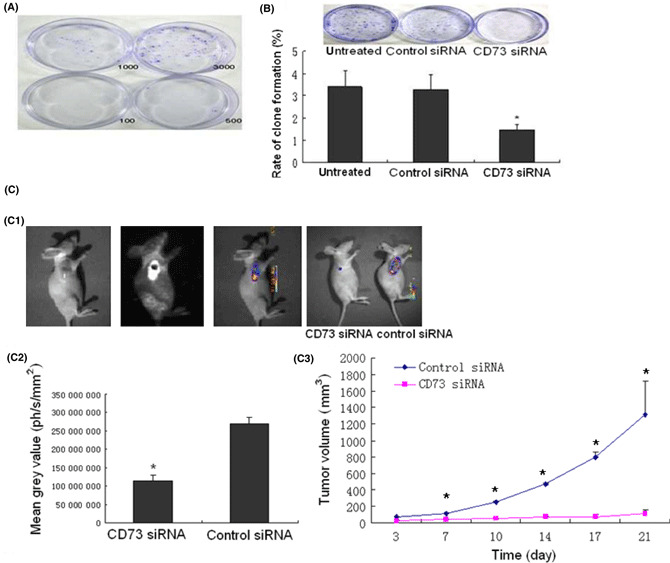
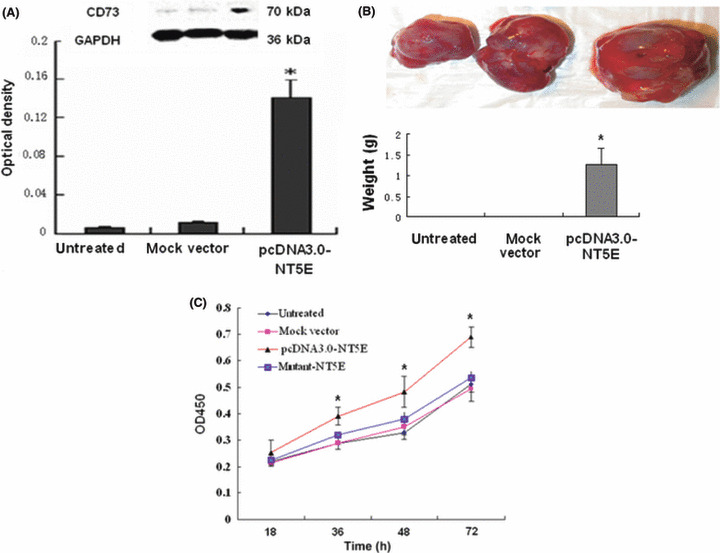
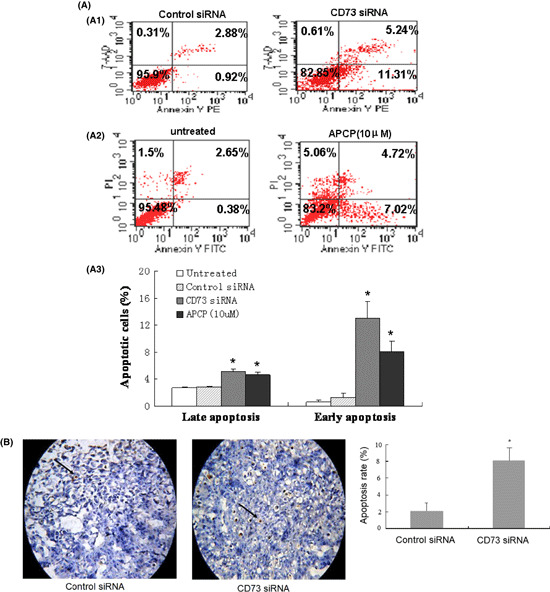
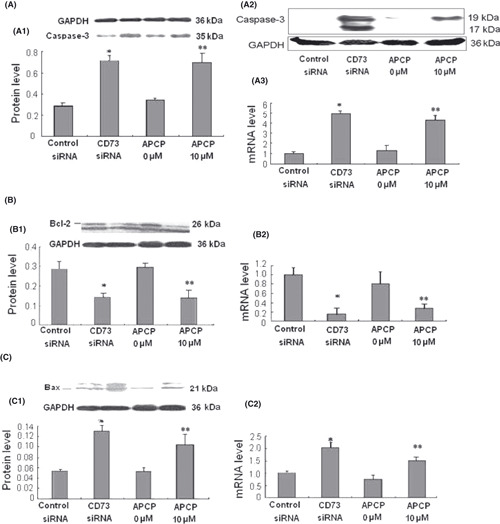
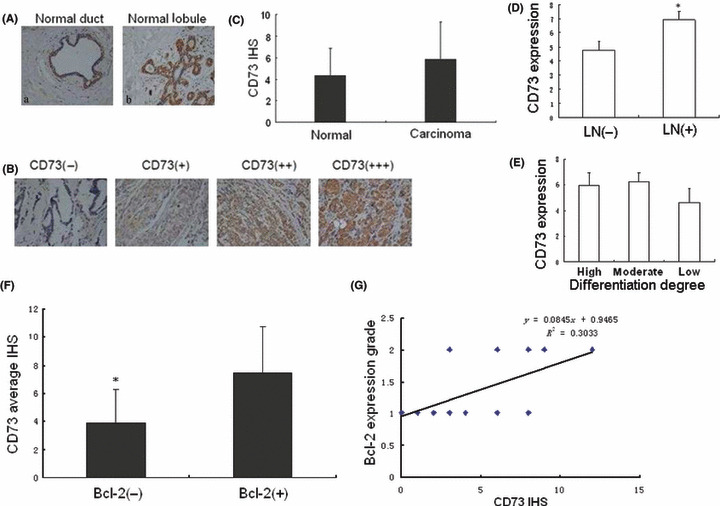
Ecto-5'-nucleotidase (CD73), a cell surface protein that hydrolyzes extracellular AMP into adenosine and phosphate, is overexpressed in many solid tumors. In this study, we tested the hypothesis that increased CD73 may promote tumor progression by examining the effect of CD73 suppression via RNA interference and CD73 overexpression on tumor growth in vivo and in vitro. Using digitized whole-body images, plate clone forming assay and TUNEL assay in frozen tissue sections, we found that the cell growth rate was significantly lower in vivo and in vitro after CD73 suppression and late apoptosis was much higher in xenograft tumors developed from the CD73-siRNA transfected MB-MDA-231 clone (P1). By flow cytometry, the P1 cell cycle was arrested in the G0/G1 phase. Moreover, Bcl-2 was downregulated, while Bax and caspase-3 were upregulated with CD73 suppression. CD73 inhibitor α,β-methylene adenosine-5'-disphosphate (APCP) functioned similarly with RNAi-mediated CD73 suppression. In addition, in transfected MCF-7 cells, we found that CD73 overexpression increased cell viability and promoted cell cycle progression, depending on its enzyme activity. More intriguingly, CD73 overexpression in MCF-7 breast cancer cells produces a tumorigenic phenotype. We conclude that CD73 plays an important role in breast cancer growth by affecting cell cycle progression and apoptosis.


Figures

Figure 1
Figure 1
Identification of stably transfected cells. (A) High‐level GFP expression in transfected MB‐MDA‐231 cells detected using fluorescence microscope. (B) Analysis of the green fluorescent population of P1 cells cultured with G418 by flow cytometry (FCM). (C) Representative high performance liquid chromatography (HPLC) of E‐AMP and E‐Ado. Fluorescence was detected at a wavelength of 270/418 nm (excitation/emission). (D) Surface CD73 enzyme activity assessed by measuring E‐Ado with HPLC. The enzyme activity decreased in CD73 siRNA transfected cells and in APCP (10 μm) treated cells (n = 8; *P < 0.05 vs control siRNA and untreated groups, respectively).
Figure 2
Figure 2
Effect of CD73 on cell growth in vivo and in vitro. (A) MB‐MDA‐231 cells (100, 500, 1 × 103 and 3 × 103) were used for colony formation assays and 3 × 103 was the optimal number of cells. (B) Colony formation assays for three groups (untreated, control siRNA and CD73 siRNA) were performed. The colony numbers were much lower in CD73 siRNA transfected cells than in the untreated and control transfected cells (n = 3; *P < 0.05 vs untreated and control siRNA groups). (C) In vivo tumor growth. C1: whole body imaging of nude mice. The left two pictures are photographed with optic and fluorescent imaging systems, respectively. The third picture is the integrated photo of the two. The fourth picture depicts two tumor‐bearing mice showing that CD73 RNAi inhibited growth of transplanted tumor. C2: the GFP fluorescence area and intensity were substantially greater in the control xenograft than those from P1 cells at 21 days. C3: tumor growth curve by regular measurement. CD73 RNAi inhibited growth of transplanted tumor (n = 5; *P < 0.05 vs control siRNA groups).
Figure 3
Figure 3
The effect of CD73 overexpression on cell growth. (A) CD73 expression analysis by western blot. CD73 expression was increased in MCF‐7 cells after pcDNA3.0‐NT5E transfection. (B) In vivo tumor growth. None of the control cells or parental MCF‐7 cells gave rise to tumors after 21 days, while 3/5 mice injected with pcDNA3.0‐NT5E transfected MCF7 cells produced tumors that grew in a rapid fashion (n = 5; *P < 0.05). (C) CCK‐8 assay. Cell viability was increased in pcDNA3.0‐NT5E transfected MCF‐7 cells, while transfection of mutant constructions substituted active site (His 92) to Ala does not promote MCF‐7 cell viability (n = 3; *P < 0.05 vs untreated, mock vector and mutant‐NT5E groups).
Figure 4
Figure 4
Cell apoptosis detected by flow cytometry and TUNEL assay. (A) Both early and late apoptosis rates were significantly higher in the CD73 siRNA group than in the control siRNA group, while APCP functioned similarly (n = 3; *P < 0.05 vs control siRNA and untreated). The lower right and upper right show early and late apoptosis, respectively. (B) A TUNEL assay based on the labeling of DNA strand breaks for detection of apoptosis was performed on frozen sections of xenograft tumor. P1 showed intense brown staining when compared with the control group (n = 10; *P < 0.01 vs control siRNA).
Figure 5
Figure 5
Effect of CD73 suppression on apoptotic pathways. After CD73 was suppressed by either siRNA or α,β‐methylene adenosine‐5′‐disphosphate (APCP) (10 μm), (A) Caspase‐3 expression increased at protein (A1) and mRNA (A3) levels with Caspase‐3 activation (A2); (B) Bcl‐2 expression decreased at protein (B1) and mRNA (B2) levels; but (C) Bax expression increased at both protein (C1) and mRNA (C2) levels (n = 3; *P < 0.05 vs control siRNA; **P < 0.05 vs 0 μm APCP).
Figure 6
Figure 6
Tissue microassay. (A) Expression of CD73 in normal mammary gland (×200). Left, normal mammary gland; right, lobule of normal mammary gland. (B) Expression of CD73 in breast tumor specimens with different grades. CD73 was differentially expressed in tumor cells. The glandular stroma contained fibrocytes and a subset of the fibrocytes was CD73 positive. (C) The CD73 expression level in invasive duct carcinoma (n = 49) was higher than normal mammary gland (n = 10), although the difference was not statistically significant (P > 0.05). (D,E) CD73 expression was positively related to lymph node (LN) metastasis but not to grading. (F,G) There was significant positive correlation between CD73 and bcl‐2 expressions in the breast cancer specimens (n = 25; r = 0.397; *P < 0.05). IHS, immunohistochemical score.

Similar articles

Cited by

References

    1. Walt G. WHO’s World Health Report 2003. BMJ 2004; 328: 6. - PMC - PubMed
    1. Bianchi V, Spychala J. Mammalian 5′‐nucleotidases. J Biol Chem 2003; 278: 46195–8. - PubMed
    1. Colgan SP, Eltzschig HK, Eckle T, Thompson LF. Physiological roles for ecto‐5′‐nucleotidase (CD73). Purinergic Signal 2006; 2: 351–60. - PMC - PubMed
    1. Spychala J. Tumor‐promoting functions of adenosine. Pharmacol Ther 2000; 87: 161–73. - PubMed
    1. Buffon A, Wink MR, Ribeiro BV et al. NTPDase and 5′ ecto‐nucleotidase expression profiles and the pattern of extracellular ATP metabolism in the Walker 256 tumor. Biochim Biophys Acta 2007; 1770: 1259–65. - PubMed

Publication types

MeSH terms