

Asymmetric microarray data produces gene lists highly predictive of research literature on multiple cancer types
- PMID: 20875095
- PMCID: PMC2949900
- DOI: 10.1186/1471-2105-11-483
Asymmetric microarray data produces gene lists highly predictive of research literature on multiple cancer types
Abstract
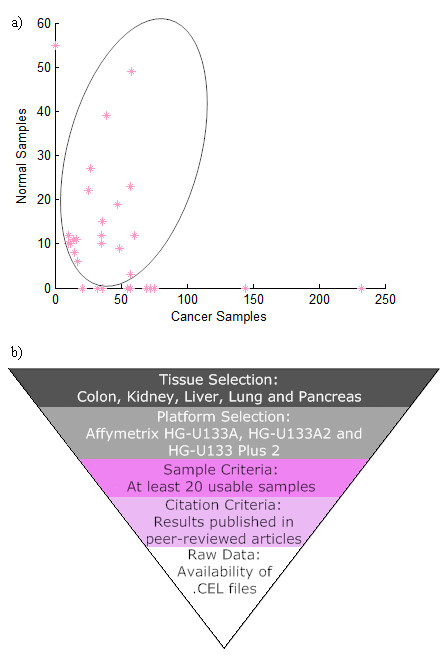
Background: Much of the public access cancer microarray data is asymmetric, belonging to datasets containing no samples from normal tissue. Asymmetric data cannot be used in standard meta-analysis approaches (such as the inverse variance method) to obtain large sample sizes for statistical power enrichment. Noting that plenty of normal tissue microarray samples exist in studies not involving cancer, we investigated the viability and accuracy of an integrated microarray analysis approach based on significance analysis of microarrays (merged SAM) using a collection of data from separate diseased and normal samples.
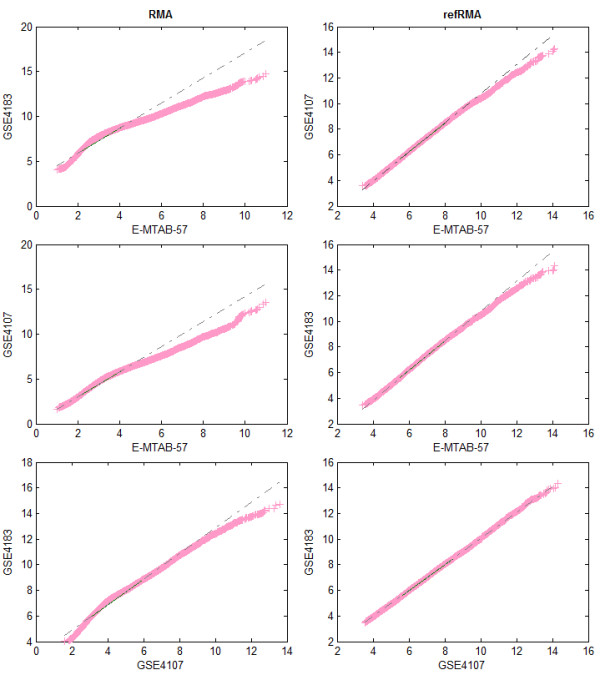
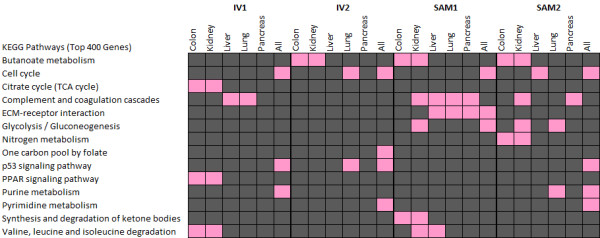
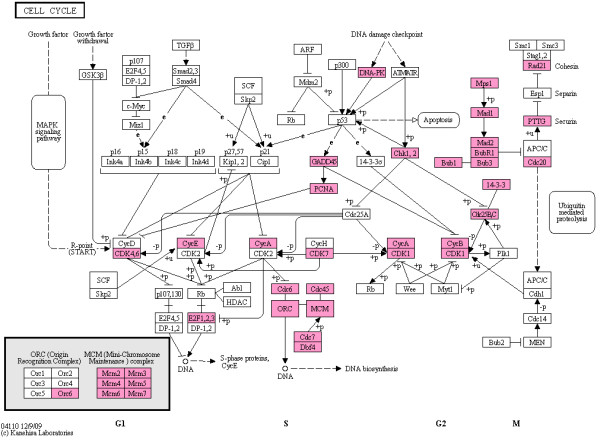
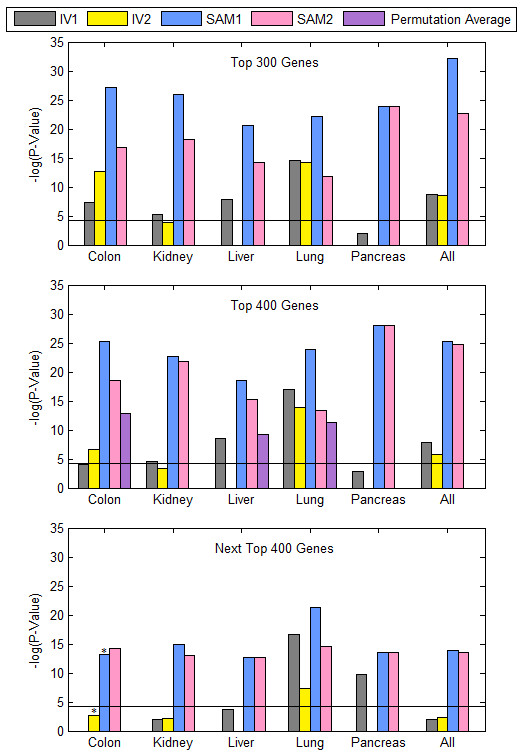
Results: We focused on five solid cancer types (colon, kidney, liver, lung, and pancreas), where available microarray data allowed us to compare meta-analysis and integrated approaches. Our results from the merged SAM significantly overlapped gene lists from the validated inverse-variance method. Both meta-analysis and merged SAM approaches successfully captured the aberrances in the cell cycle that commonly occur in the different cancer types. However, the integrated SAM analysis replicated the known cancer literature (excluding microarray studies) with much more accuracy than the meta-analysis.
Conclusion: The merged SAM test is a powerful, robust approach for combining data from similar platforms and for analyzing asymmetric datasets, including those with only normal or only cancer samples that cannot be utilized by meta-analysis methods. The integrated SAM approach can also be used in comparing global gene expression between various subtypes of cancer arising from the same tissue.
Figures

Similar articles
-
Improving gene set analysis of microarray data by SAM-GS.BMC Bioinformatics. 2007 Jul 5;8:242. doi: 10.1186/1471-2105-8-242. BMC Bioinformatics. 2007. PMID: 17612399 Free PMC article.
-
Mining published lists of cancer related microarray experiments: identification of a gene expression signature having a critical role in cell-cycle control.BMC Bioinformatics. 2005 Dec 1;6 Suppl 4(Suppl 4):S14. doi: 10.1186/1471-2105-6-S4-S14. BMC Bioinformatics. 2005. PMID: 16351740 Free PMC article.
-
Microarray data simulator for improved selection of differentially expressed genes.Cancer Biol Ther. 2003 Jul-Aug;2(4):383-91. doi: 10.4161/cbt.2.4.431. Cancer Biol Ther. 2003. PMID: 14508110
-
Microarrays for cancer diagnosis and classification.Adv Exp Med Biol. 2007;593:74-85. doi: 10.1007/978-0-387-39978-2_8. Adv Exp Med Biol. 2007. PMID: 17265718 Review.
-
Filter versus wrapper gene selection approaches in DNA microarray domains.Artif Intell Med. 2004 Jun;31(2):91-103. doi: 10.1016/j.artmed.2004.01.007. Artif Intell Med. 2004. PMID: 15219288 Review.
Cited by
-
Genome-wide expression profiling of schizophrenia using a large combined cohort.Mol Psychiatry. 2013 Feb;18(2):215-25. doi: 10.1038/mp.2011.172. Epub 2012 Jan 3. Mol Psychiatry. 2013. PMID: 22212594 Free PMC article.
-
Systematic analysis of genotype-specific drug responses in cancer.Int J Cancer. 2012 Nov 15;131(10):2456-64. doi: 10.1002/ijc.27529. Epub 2012 Mar 29. Int J Cancer. 2012. PMID: 22422301 Free PMC article.
-
Gene set analysis for self-contained tests: complex null and specific alternative hypotheses.Bioinformatics. 2012 Dec 1;28(23):3073-80. doi: 10.1093/bioinformatics/bts579. Epub 2012 Oct 7. Bioinformatics. 2012. PMID: 23044539 Free PMC article.
-
Weighted set enrichment of gene expression data.BMC Syst Biol. 2013;7 Suppl 4(Suppl 4):S10. doi: 10.1186/1752-0509-7-S4-S10. Epub 2013 Oct 23. BMC Syst Biol. 2013. PMID: 24565001 Free PMC article.
-
An integrative approach for the identification of prognostic and predictive biomarkers in rectal cancer.Oncotarget. 2015 Oct 20;6(32):32561-74. doi: 10.18632/oncotarget.4935. Oncotarget. 2015. PMID: 26359356 Free PMC article.
References
-
- Rhodes DR, Barrette TR, Rubin MA, Ghosh D, Chinnaiyan AM. Meta-analysis of microarrays: interstudy validation of gene expression profiles reveals pathway dysregulation in prostate cancer. Cancer Res. 2002;62(15):4427–4433. - PubMed
Publication types
MeSH terms
LinkOut - more resources
Full Text Sources
