. 2010 Nov 19;404(1):138-57.
doi: 10.1016/j.jmb.2010.09.043. Epub 2010 Sep 25.

The osmolyte TMAO stabilizes native RNA tertiary structures in the absence of Mg2+: evidence for a large barrier to folding from phosphate dehydration

Affiliations

The osmolyte TMAO stabilizes native RNA tertiary structures in the absence of Mg2+: evidence for a large barrier to folding from phosphate dehydration

Dominic Lambert et al. J Mol Biol. .

Abstract

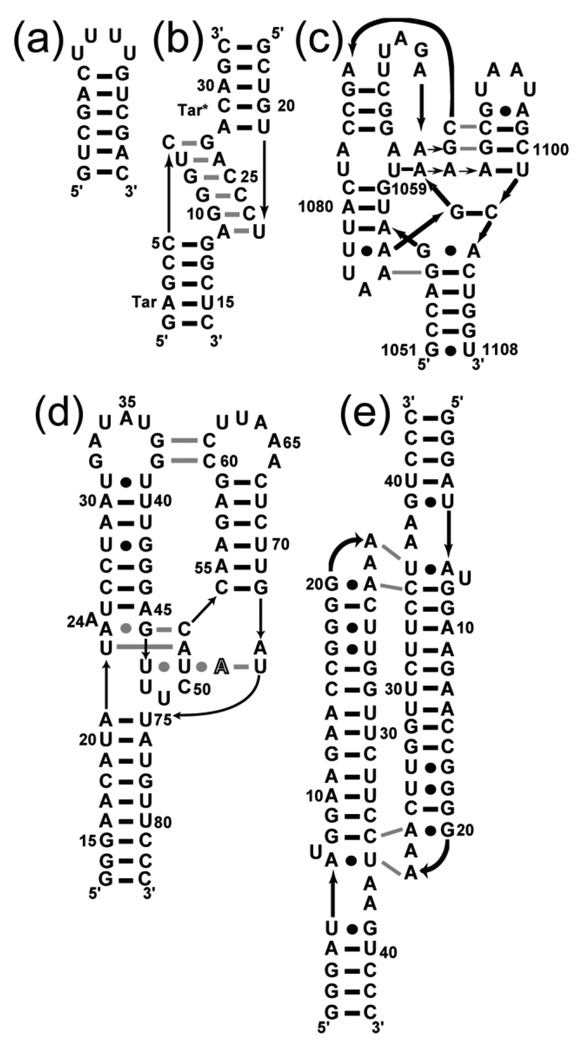
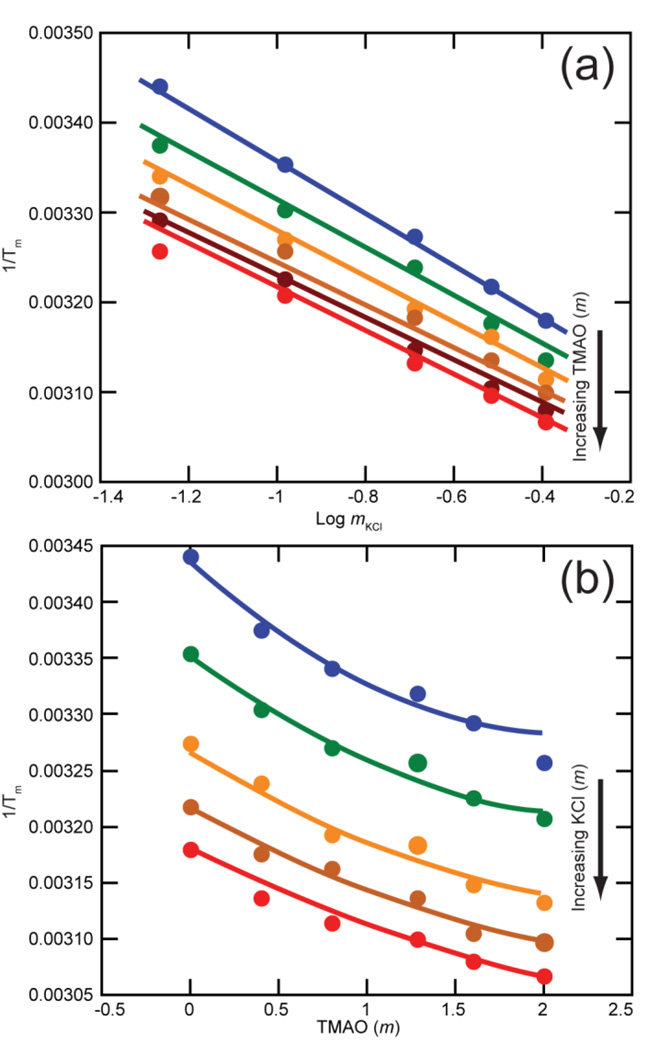
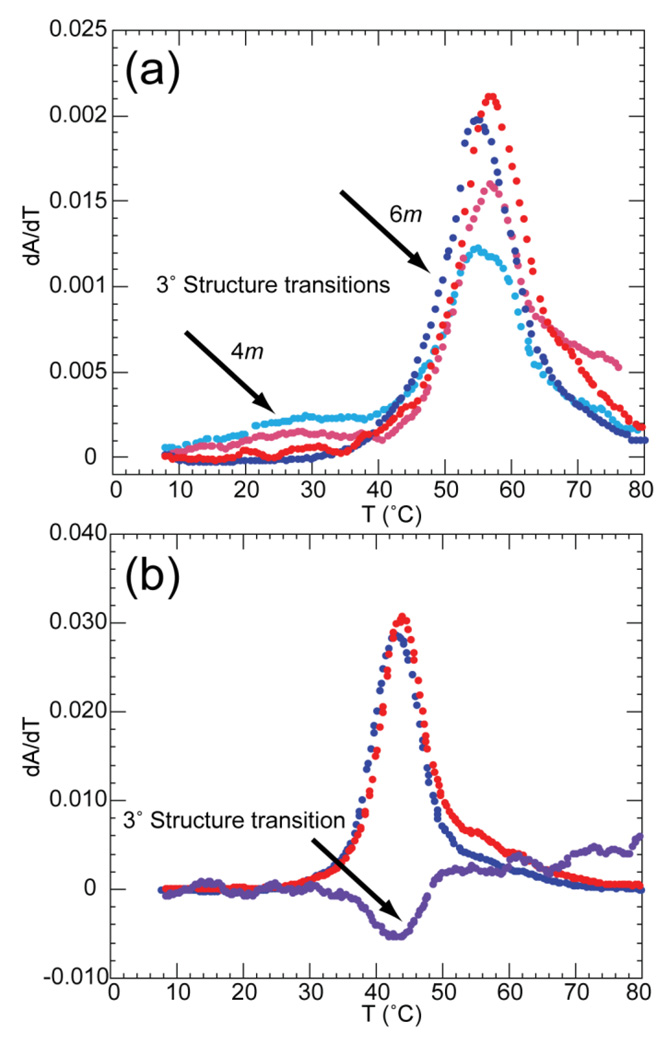
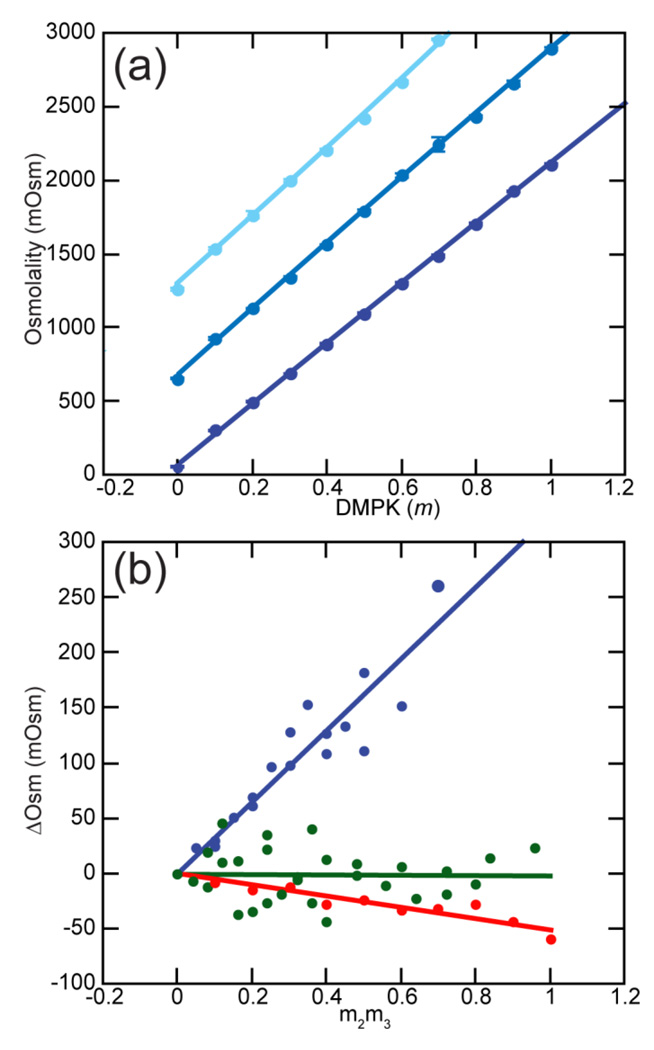
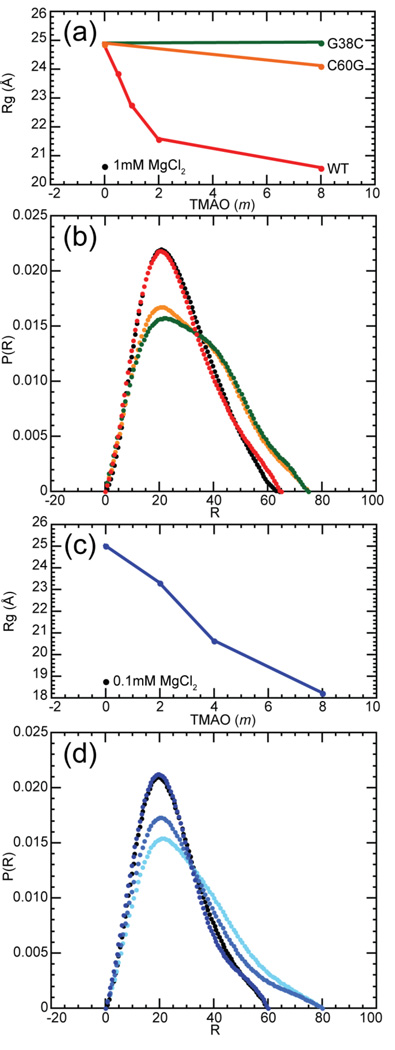
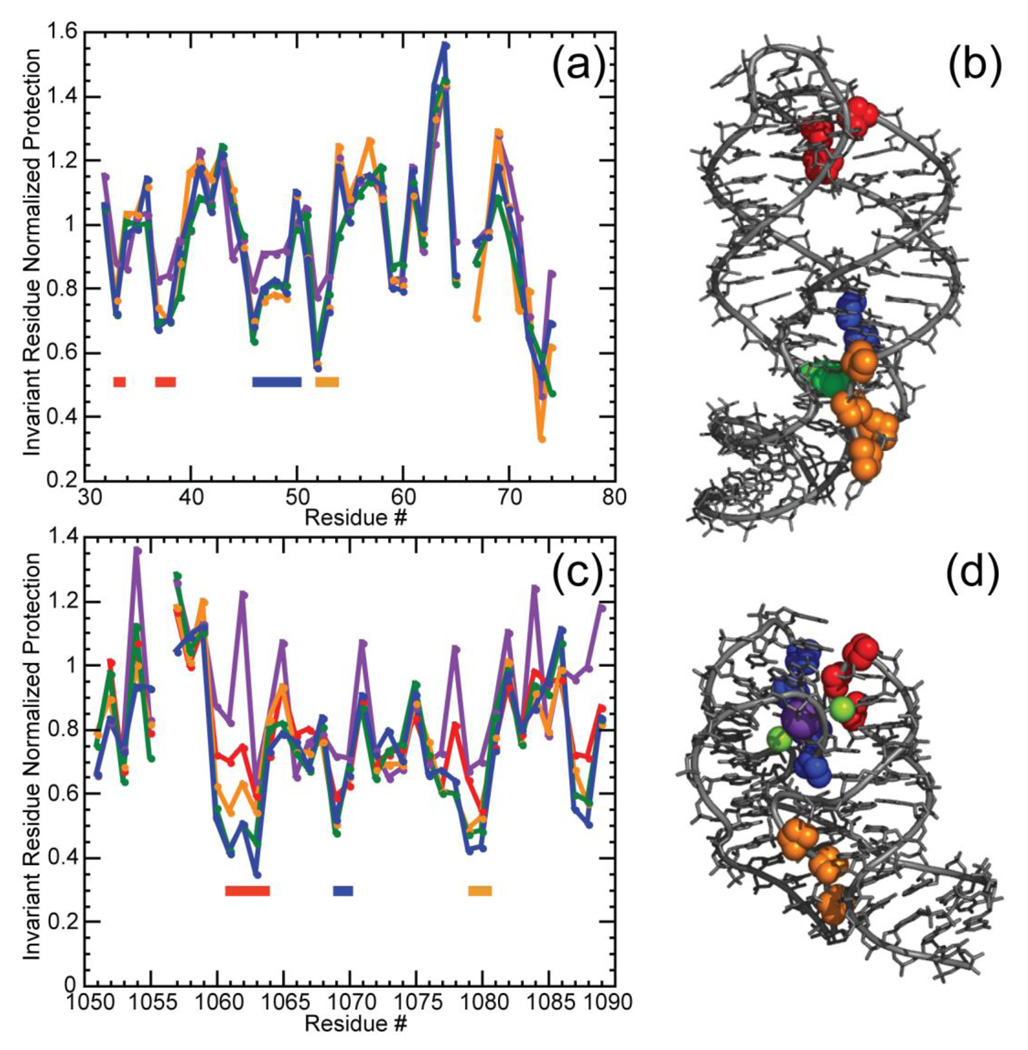
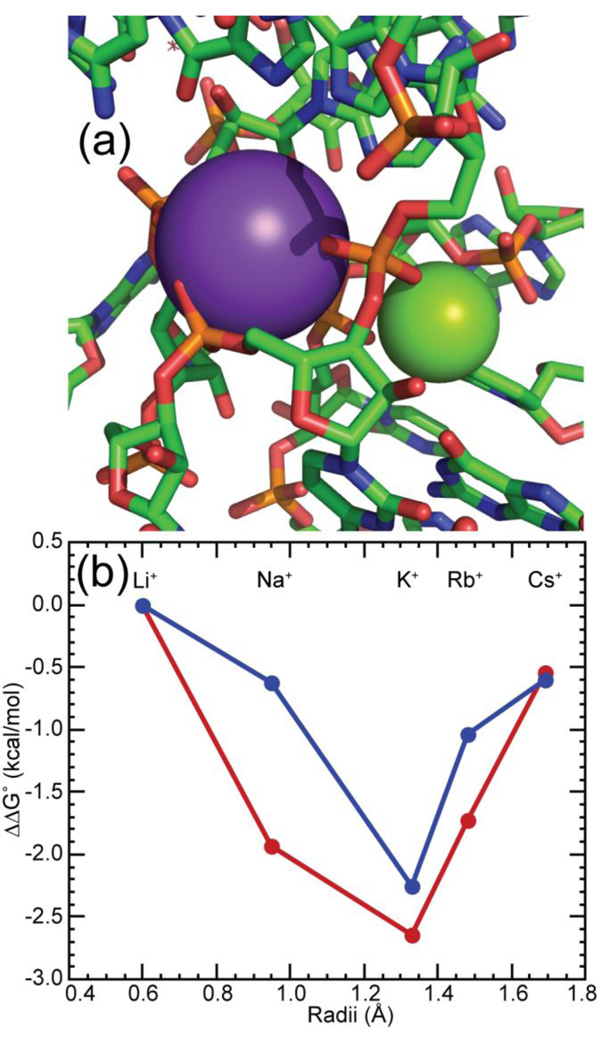
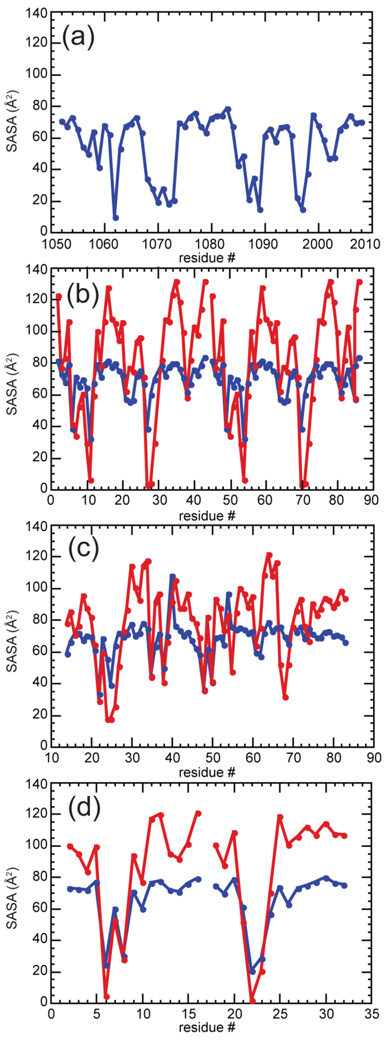
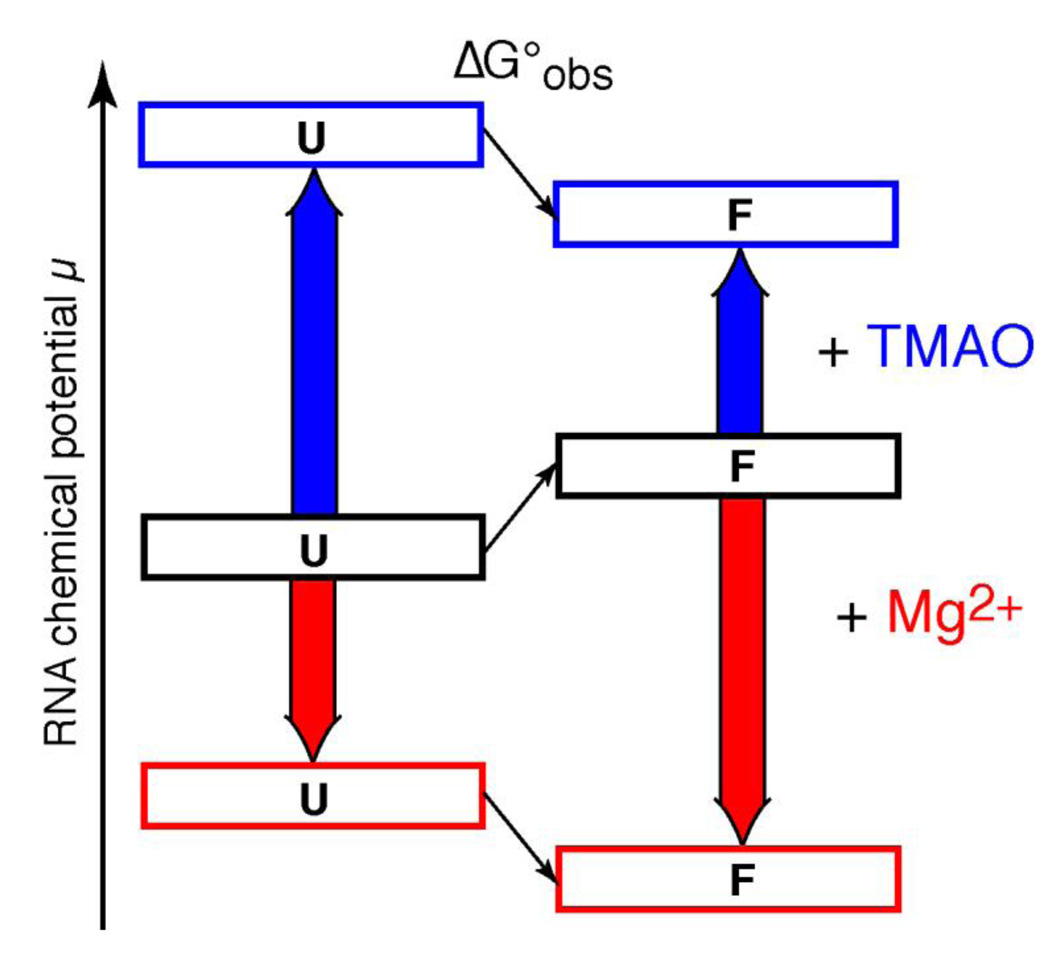
The stabilization of RNA tertiary structures by ions is well known, but the neutral osmolyte trimethylamine oxide (TMAO) can also effectively stabilize RNA tertiary structure. To begin to understand the physical basis for the effects of TMAO on RNA, we have quantitated the TMAO-induced stabilization of five RNAs with known structures. So-called m values, the increment in unfolding free energy per molal of osmolyte at constant KCl activity, are ∼0 for a hairpin secondary structure and between 0.70 and 1.85 kcal mol(-1)m(-1) for four RNA tertiary structures (30-86 nt). Further analysis of two RNAs by small-angle X-ray scattering and hydroxyl radical probing shows that TMAO reduces the radius of gyration of the unfolded ensemble to the same endpoint as seen in titration with Mg(2+) and that the structures stabilized by TMAO and Mg(2+) are indistinguishable. Remarkably, TMAO induces the native conformation of a Mg(2+) ion chelation site formed in part by a buried phosphate, even though Mg(2+) is absent. TMAO interacts weakly, if at all, with KCl, ruling out the possibility that TMAO stabilizes RNA indirectly by increasing salt activity. TMAO is, however, strongly excluded from the vicinity of dimethylphosphate (unfavorable interaction free energy, +211 cal mol(-1)m(-1) for the potassium salt), an ion that mimics the RNA backbone phosphate. We suggest that formation of RNA tertiary structure is accompanied by substantial phosphate dehydration (loss of 66-173 water molecules in the RNA structures studied) and that TMAO works principally by reducing the energetic penalty associated with this dehydration. The strong parallels we find between the effects of TMAO and Mg(2+) suggest that RNA sequence is more important than specific ion interactions in specifying the native structure.


Figures

Figure 1
Figure 1
Schematics of the secondary and tertiary structures of the RNAs used in this study. Horizontal black bars and bullets represent Watson-Crick and non-canonical base pairs, respectively. Gray lines symbolize base-base tertiary interactions and black lines with arrow-heads represent 5’-3’ backbone connectivity. (a) A designed hairpin. (b) The tar-tar* kissing-loops complex. (c) Nucleotides 1051–1108 of the E. coli 16S rRNA, with a mutation (U1061A) that stabilizes tertiary structure (58mer RNA). (d) The aptamer domain of the adenine-binding riboswitch with adenine ligand depicted in outline typeface (A-riboswitch). (e) The tetraloop-receptor RNA (TLR).
Figure 2
Figure 2
Salt and TMAO dependences of tertiary structure stability of the A-riboswitch aptamer domain, plotted as (1/Tm) obtained from melting experiments. The two panels show the same set of 30 different conditions. The drawn curves are least squares best fits all derived from the same three dimensional surface specified by six fitting parameters (see Materials and Methods). (a) KCl dependence at fixed TMAO concentrations: blue, no TMAO; green, 0.4 m; orange, 0.8 m; brown, 1.284 m, dark brown, 1.6 m; red, 2.0 m. (b) Data from panel A replotted to show TMAO dependence at fixed K+ concentrations: blue, 54 mm; green, 104 mm; orange, 204 mm; brown, 304 mm; red, 404 mm. Each melt sample contained 50 mm KMOPS pH 7.0, 5 µm DAP and 2 µm EDTA along with additional KCl and TMAO to give the indicated concentrations. Errors bars are smaller than the size of data points.
Figure 3
Figure 3
Melt profiles of 58mer RNA in various TMAO and salt concentrations. A) Data sets were collected at 260 (blue) and 280 (red) nm in buffer containing 400 mm K+, 2 µm EDTA and either 100 mm K-MOPS pH 6.8 with 4 m TMAO (light shades), or 160 mm K-MOPS pH 6.8 and 6 m TMAO (dark shades). B) Data were collected at 260 (blue), 280 (red), and 295 (purple) nm in the presence of 52.4 mm K+, 2 µm EDTA, 182 mm K-MOPS and 7.7 m TMAO. Arrows indicate the change in ratio of absorbance at 260/280nm (A) or 295nm signal (B) corresponding to melting of tertiary structure.
Figure 4
Figure 4
Vapor Pressure Osmometry (VPO) measurements and analysis. (a) Osmolality of potassium dimethylphosphate (K-DMP) with (from bottom to top) 0, 0.5, or 1.0 m TMAO. Fitted curves are second order polynomials. Error bars are shown, but are generally smaller than the data points. (b) The non-additivity of TMAO and solute osmolalities (ΔOsm) plotted according to eqs 7–8. Lines are linear least squares fits; the slopes are reported in Table 3 as μ23/RT. Blue, TMAO and K-DMAP; green, TMAO and KCl; red, TMAO and glycerol.
Figure 5
Figure 5
Dimensions of A-riboswitch and 58mer RNAs at various TMAO and Mg2+ concentrations, as determined by SAXS. (a) Rg of the A-riboswitch wildtype sequence (red) and two folding-impaired variants, C60G (orange) and G28C (green), in 182 mm KMOPS pH 6.8, 2 µm EDTA, 50 mm K+, and various molalities of TMAO. For comparison purposes, Rg in the same buffer containing 1 mM Mg2+ (black point) is also indicated. (b) Distance distribution functions of the A-riboswitch with 8 m TMAO (red) or 1mm Mg2+ (black), and of the G38C (green) and C60G variants (orange) with 8 m TMAO. Other buffer components are the same as in panel (a). (c) Rg of the 58mer RNA (blue) in 182 mm MOPS pH 6.8, 2 µm EDTA, 50 mm K+, and various molalities of TMAO. For comparison purposes, Rg in the same buffer containing 0.1mm Mg2+ (black) is also indicated. In both panels (a) and (c), error bars are smaller than the size of the data points. (d) Distance distribution function of the 58mer rRNA in 2 m TMAO (light blue), 4 m TMAO (medium blue), 8 m (dark blue), and 0.1 mm Mg2+ (black). Other buffer components are the same as in panel (c).
Figure 6
Figure 6
Normalized data for the reactivity of the A-riboswitch (a, b) and 58mer rRNA fragment (c, d) towards hydroxyl radical. Gel band intensities have been normalized as described (Materials and Methods). (a) Reactivity of the A-riboswitch was assayed in K-MOPS buffer pH 6.8, 50 mm K+ plus no TMAO (purple); 5 m TMAO (yellow); 8 m TMAO (green) or 5 mm MgCl2 (blue). MOPS anion concentrations were 20 mm (no TMAO or MgCl2), 125 mm (5 m TMAO) or 182 mm (8 m TMAO). Regions of increased protection compared to the unfolded conformation are indicated by colored bars corresponding to residues depicted in panel (b). (b) Residues protected from hydroxyl radical displayed on the A-riboswitch crystal structure (1Y26) where residues 33, 37 and 38 are colored in red, 46 to 49 are displayed in blue, and 52 and 53 are shown in yellow. The adenine ligand is depicted in green. (c) Reactivity of the 58mer RNA obtained in K-MOPS buffer pH 6.8, 60 mM K+ plus no TMAO (purple); 4 m TMAO (red), 5 m TMAO (yellow), 8m TMAO (green); or 5 mm MgCl2 (blue). MOPS anion concentrations were 20 mm (no TMAO or MgCl2), 100 mm (4 m TMAO) 125 mm (5 m TMAO) or 182 mm (8 m TMAO). Regions of increased protection compared to the unfolded conformation are indicated by colored bars corresponding to residues depicted in panel (d). (d) Representation of residues protected from hydroxyl radical on the 58mer rRNA crystal structure (1HC8) where residues 18 to 21 are colored in red, 35 to 37 are depicted in blue and 45 to 47 are indicated in yellow. Residues 14 in the 58mer and 66 in the A-riboswitch were impossible to quantify accurately and were not plotted. Protection assessments for residues at the 3’end, which correspond nucleotides at the bottom of the gel, were also unreliable.
Figure 7
Figure 7
The 58mer RNA ion-binding pocket confers a specific monovalent ion requirement for optimal stability. (a) View of the crystal structure of the 58mer RNA (1HC8) regions surrounding chelated K+ (violet sphere) and Mg2+ (green sphere) ions. Anionic oxygens of A1073 contact either the K+ or Mg2+ ion. (b) Relative free energy changes for folding the 58mer rRNA fragment with either 0.5 mM MgCl2 (blue) or 6 m TMAO (red) added to buffer with different group I ions (1 m M+, 150 mm M-MOPS pH 6.8, 2 µm EDTA). The ionic radii are taken from Pauling.
Figure 8
Figure 8
Solvent accessible surface areas (SASA) of phosphates groups for four RNAs with tertiary structure (Figure 1). (a) 58mer rRNA (1HC8), (b) the two monomers from the tetraloop-receptor RNA complex (2JYF), (c) A-riboswitch (1Y26), and (d) Tar-tar* (1KIS). Blue data points indicates SASA obtained with a probe radius of 1.4 Å whereas red points correspond to a probe radius of 2.8 Å.
Figure 9
Figure 9
Contrasting mechanisms by which Mg2+ and TMAO may stabilize the same RNA tertiary structure. The relative free energy (chemical potential) of folded (F) and unfolded (U) forms of a hypothetical RNA tertiary structure are diagrammed. In buffer, the U form of the RNA is represented as more stable than F (black boxes; the observed folding free energy, ΔG°obs, is positive). Mg2+ interacts strongly (red arrows) with both U and F forms of the RNA, but preferentially stabilizes the native structure (red boxes; ΔG°obs is now negative). TMAO interactions with both U and F forms are strongly unfavorable (blue arrows), but the U form is more strongly affected because of its more extensive exposure of phosphates to solvent. Therefore ΔG°obs becomes negative (blue boxes).

Similar articles

Cited by

References

    1. Yancey PH, Clark ME, Hand SC, Bowlus RD, Somero GN. Living with water stress: evolution of osmolyte systems. Science. 1982;217:1214–1222. - PubMed
    1. Cayley DS, Guttman HJ, Record MT., Jr Biophysical characterization of changes in amounts and activity of Escherichia coli cell and compartment water and turgor pressure in response to osmotic stress. Biophys J. 2000;78:1748–1764. - PMC - PubMed
    1. Liu Y, Bolen DW. The peptide backbone plays a dominant role in protein stabilization by naturally occurring osmolytes. Biochemistry. 1995;34:12884–12891. - PubMed
    1. Timasheff SN. Control of protein stability and reactions by weakly interacting cosolvents: the simplicity of the complicated. Adv Protein Chem. 1998;51:355–432. - PubMed
    1. Courtenay ES, Capp MW, Saecker RM, Record MT., Jr Thermodynamic analysis of interactions between denaturants and protein surface exposed on unfolding: interpretation of urea and guanidinium chloride m-values and their correlation with changes in accessible surface area (ASA) using preferential interaction coefficients and the local-bulk domain model. Proteins Suppl. 2000;4:72–85. - PubMed

Publication types