

Interactions of lifetime lead exposure and stress: behavioral, neurochemical and HPA axis effects
- PMID: 20875452
- PMCID: PMC3030678
- DOI: 10.1016/j.neuro.2010.09.004
Interactions of lifetime lead exposure and stress: behavioral, neurochemical and HPA axis effects
Abstract
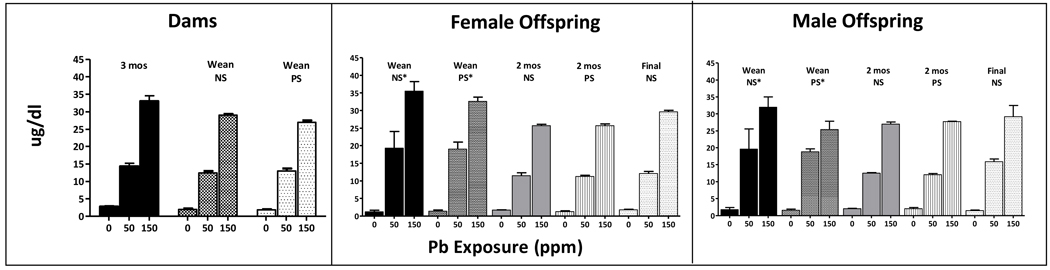
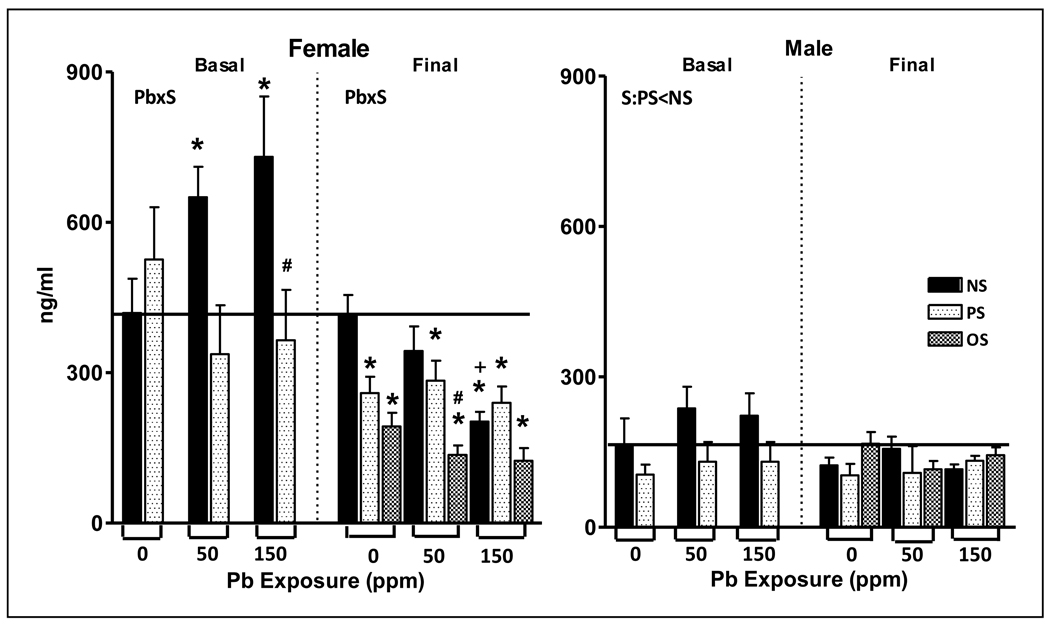
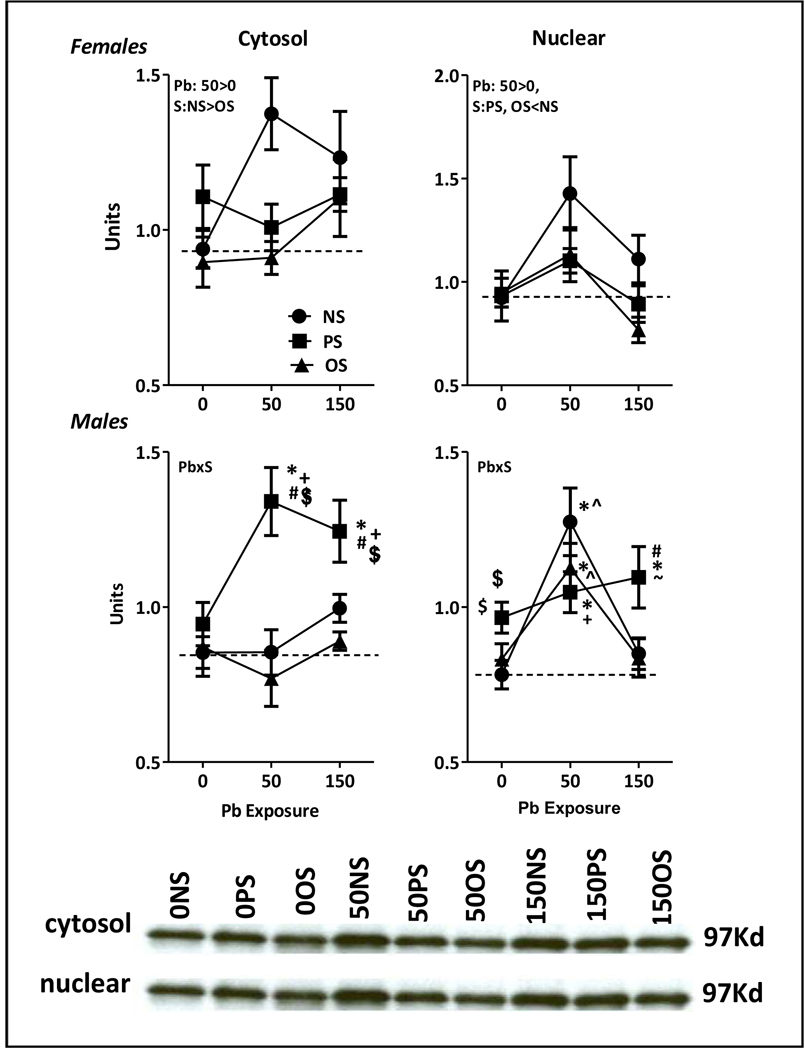
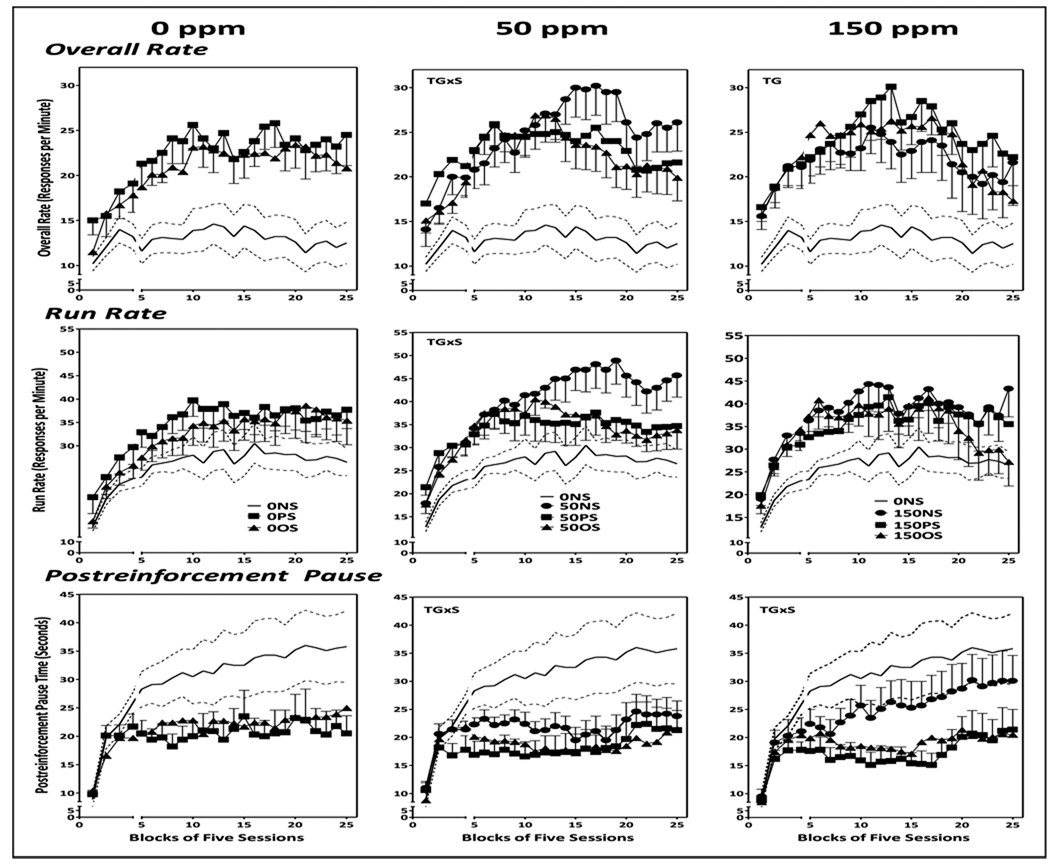
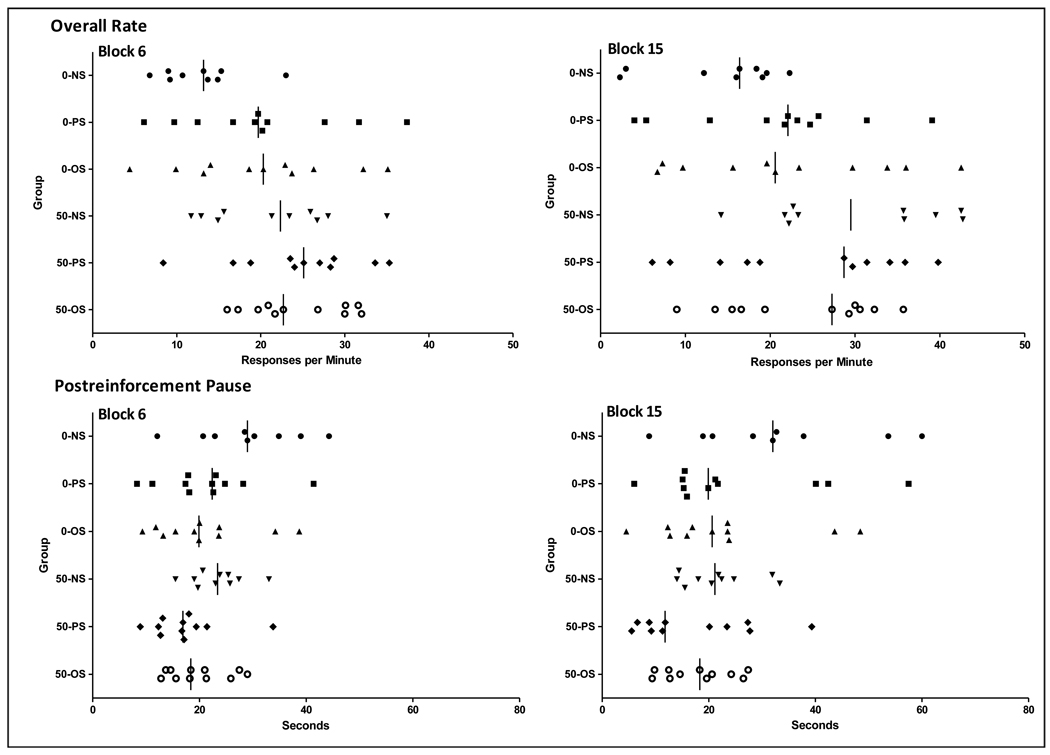
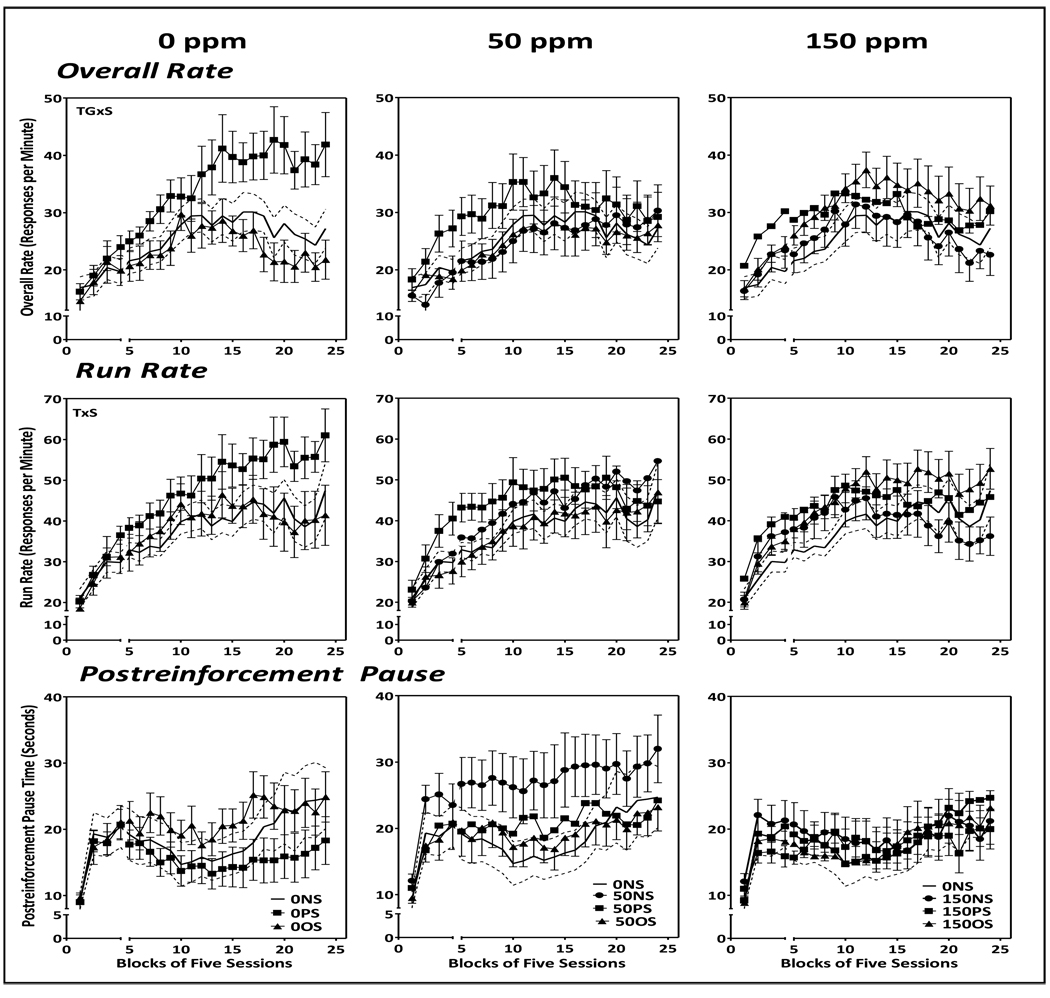
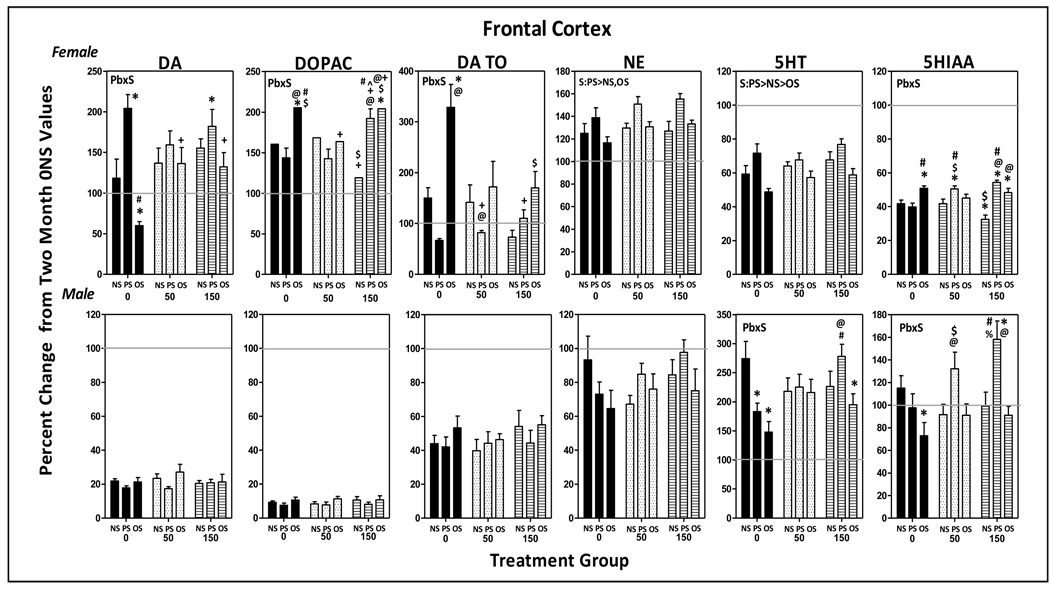
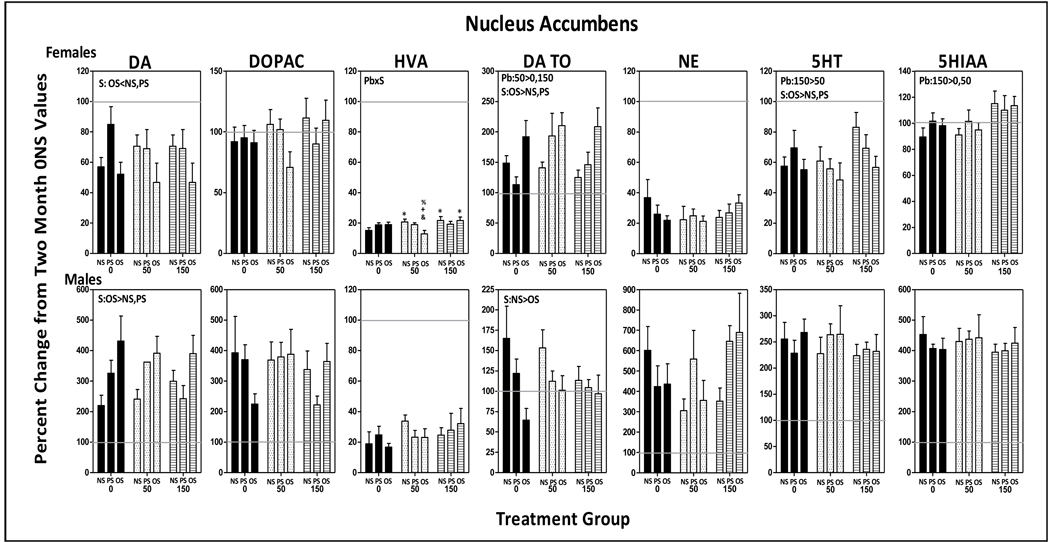
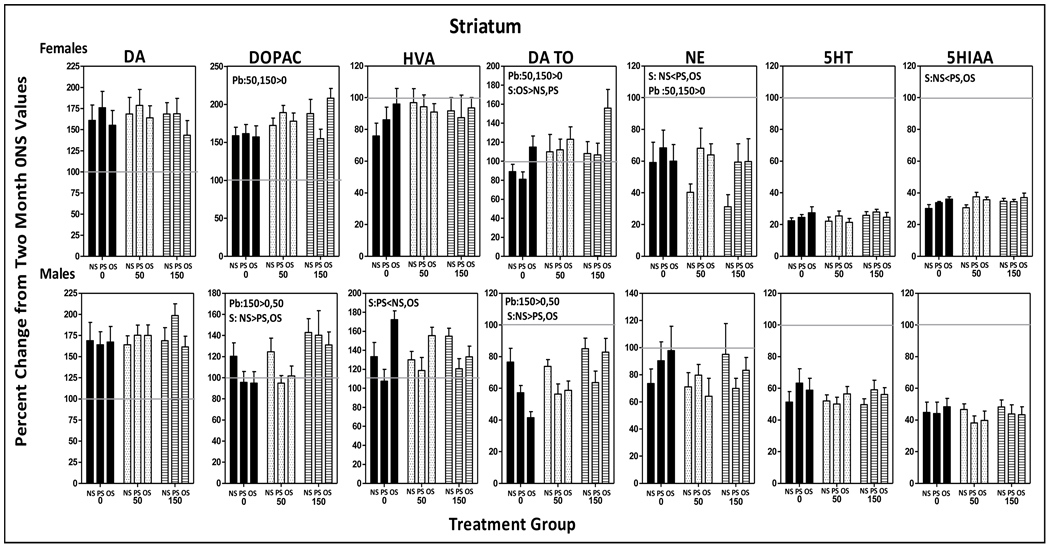
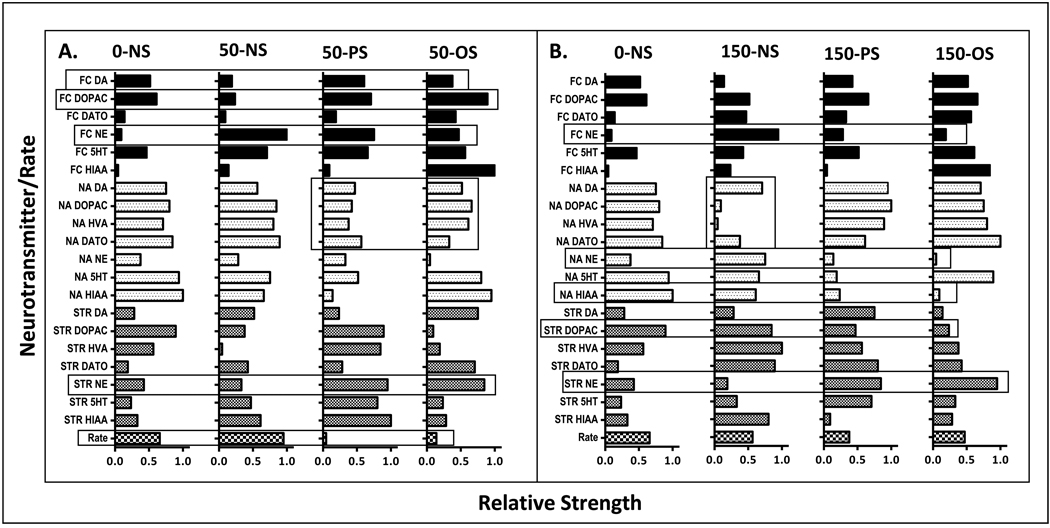
Lead (Pb) and stress co-occur as risk factors, share biological substrates and produce common adverse effects. We previously found that prenatal restraint stress (PS) or offspring stress (OS) could enhance maternal Pb-induced behavioral, brain neurotransmitter level and HPA axis changes. The current study examined how lifetime Pb exposure, consistent with human environmental exposure, interacts with stress. Dams were exposed to Pb beginning 2 mos prior to breeding (0, 50 or 150ppm in drinking water), PS on gestational days 16 and 17, or the combination. Offspring continued on the same Pb exposure as the dam. A subset of Pb+PS offspring also received 3 additional stress challenges (OS), yielding 9 exposure groups/gender: 0-NS, 0-PS, 0-OS, 50-NS, 50-PS, 50-OS, 150-NS, 150-PS and 150-OS. As with maternal Pb (Virgolini et al., 2008a), lifetime Pb and stress influenced Fixed Interval (FI) behavior primarily in females. Relative to 0-NS control, reductions in postreinforcement pause (PRP) times were seen only with combined Pb+PS (50-PS, 50-OS, 150-PS). Stress increased FI response rates when Pb alone was without effect (150-PS, 150-OS), but gradually mitigated rate increases produced by Pb alone (50-PS, 50-OS), effects that appear to be due primarily to PS, as they were of comparable magnitude in PS and OS groups. Individual subject data suggest that enhanced Pb and PS effects reflect increasing numbers of subjects shifting to the high end of the normal range of FI performance values, consistent with a dose-response type of Pb+stress additivity. Consistent with reports of cortico-striatal mediation of both interval timing (PRP) and FI rates, principal component analyses suggested potential mediation via altered frontal cortex norepinephrine, reduced nucleus accumbens dopaminergic control and enhanced striatal monoamine control. Altered FI performance, whether occurring through changes in response rate, PRP, or both, represent behavioral inefficiency and potentially sub-optimal or even dysfunctional resource/energy use.
Copyright © 2010 Elsevier Inc. All rights reserved.
Figures
Similar articles
-
Influence of low level maternal Pb exposure and prenatal stress on offspring stress challenge responsivity.Neurotoxicology. 2008 Nov;29(6):928-39. doi: 10.1016/j.neuro.2008.09.010. Epub 2008 Oct 5. Neurotoxicology. 2008. PMID: 18951918 Free PMC article.
-
Sex-dependent impacts of low-level lead exposure and prenatal stress on impulsive choice behavior and associated biochemical and neurochemical manifestations.Neurotoxicology. 2014 Sep;44:169-83. doi: 10.1016/j.neuro.2014.06.013. Epub 2014 Jul 7. Neurotoxicology. 2014. PMID: 25010656 Free PMC article.
-
Alterations in glucocorticoid negative feedback following maternal Pb, prenatal stress and the combination: a potential biological unifying mechanism for their corresponding disease profiles.Toxicol Appl Pharmacol. 2009 Jan 1;234(1):117-27. doi: 10.1016/j.taap.2008.10.003. Epub 2008 Oct 15. Toxicol Appl Pharmacol. 2009. PMID: 18977374 Free PMC article.
-
Lifetime consequences of combined maternal lead and stress.Basic Clin Pharmacol Toxicol. 2008 Feb;102(2):218-27. doi: 10.1111/j.1742-7843.2007.00189.x. Basic Clin Pharmacol Toxicol. 2008. PMID: 18226077 Review.
-
Epigenetic programming of the stress response in male and female rats by prenatal restraint stress.Brain Res Rev. 2008 Mar;57(2):571-85. doi: 10.1016/j.brainresrev.2007.11.004. Epub 2007 Nov 28. Brain Res Rev. 2008. PMID: 18164765 Review.
Cited by
-
Enhanced stimulus sequence-dependent repeated learning in male offspring after prenatal stress alone or in conjunction with lead exposure.Neurotoxicology. 2012 Oct;33(5):1188-202. doi: 10.1016/j.neuro.2012.06.013. Epub 2012 Jul 13. Neurotoxicology. 2012. PMID: 22796262 Free PMC article.
-
Developmental exposure to concentrated ambient ultrafine particulate matter air pollution in mice results in persistent and sex-dependent behavioral neurotoxicity and glial activation.Toxicol Sci. 2014 Jul;140(1):160-78. doi: 10.1093/toxsci/kfu059. Epub 2014 Apr 1. Toxicol Sci. 2014. PMID: 24690596 Free PMC article.
-
Lead Induces Apoptosis and Histone Hyperacetylation in Rat Cardiovascular Tissues.PLoS One. 2015 Jun 15;10(6):e0129091. doi: 10.1371/journal.pone.0129091. eCollection 2015. PLoS One. 2015. PMID: 26075388 Free PMC article.
-
Engaging Communities in Research on Cumulative Risk and Social Stress-Environment Interactions: Lessons Learned from EPA's STAR Program.Environ Justice. 2015 Dec 1;8(6):203-212. doi: 10.1089/env.2015.0025. Environ Justice. 2015. PMID: 27688822 Free PMC article.
-
Potential frameworks to support evaluation of mechanistic data for developmental neurotoxicity outcomes: A symposium report.Neurotoxicol Teratol. 2020 Mar-Apr;78:106865. doi: 10.1016/j.ntt.2020.106865. Epub 2020 Feb 14. Neurotoxicol Teratol. 2020. PMID: 32068112 Free PMC article.
References
-
- Cheng Y, Schwartz J, Sparrow D, Aro A, Weiss ST, Hu H. Bone lead and blood lead levels in relation to baseline blood pressure and the prospective development of hypertension: the Normative Aging Study. Am. J. Epidemiol. 2001;153:164–171. - PubMed
-
- Gerr F, Letz R, Stokes L, Chettle D, McNeill F, Kaye W. Association between bone lead concentration and blood pressure among young adults. Am. J. Ind. Med. 2002;42:98–106. - PubMed
Publication types
MeSH terms
Substances
Grants and funding
LinkOut - more resources
Full Text Sources
Research Materials
Miscellaneous
