

Automatic Bayesian classification of healthy controls, bipolar disorder, and schizophrenia using intrinsic connectivity maps from FMRI data
- PMID: 20876002
- PMCID: PMC2982883
- DOI: 10.1109/TBME.2010.2080679
Automatic Bayesian classification of healthy controls, bipolar disorder, and schizophrenia using intrinsic connectivity maps from FMRI data
Abstract
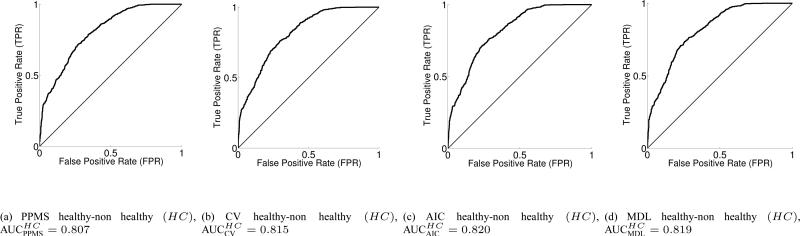
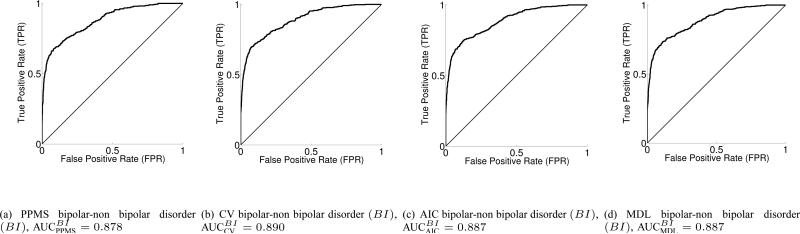
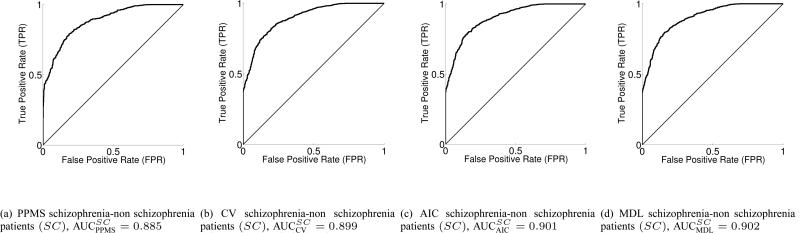
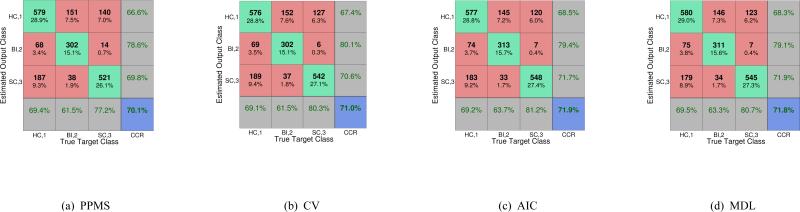
We present a method for supervised, automatic, and reliable classification of healthy controls, patients with bipolar disorder, and patients with schizophrenia using brain imaging data. The method uses four supervised classification learning machines trained with a stochastic gradient learning rule based on the minimization of Kullback-Leibler divergence and an optimal model complexity search through posterior probability estimation. Prior to classification, given the high dimensionality of functional MRI (fMRI) data, a dimension reduction stage comprising two steps is performed: first, a one-sample univariate t-test mean-difference T(score) approach is used to reduce the number of significant discriminative functional activated voxels, and then singular value decomposition is performed to further reduce the dimension of the input patterns to a number comparable to the limited number of subjects available for each of the three classes. Experimental results using functional brain imaging (fMRI) data include receiver operation characteristic curves for the three-way classifier with area under curve values around 0.82, 0.89, and 0.90 for healthy control versus nonhealthy, bipolar disorder versus nonbipolar, and schizophrenia patients versus nonschizophrenia binary problems, respectively. The average three-way correct classification rate (CCR) is in the range of 70%-72%, for the test set, remaining close to the estimated Bayesian optimal CCR theoretical upper bound of about 80% , estimated from the one nearest-neighbor classifier over the same data.
Figures


References
-
- Pearlson GD, Barta PE, Powers RE, Menon RR, Richards SS, Aylward EH, Federman EB, Chase GA, Petty RG, Tien AY. Medial and superior temporal gyral volumes and cerebral asymmetry in schizophrenia versus bipolar disorder. Biological Psychiatry. 1997;41(1):1–14. - PubMed
-
- Weinberger DR, Egan MF, Bertolino A, Callicott JH, Mattay VS, Lipska BK, Berman KF, Goldberg TE. Prefrontal neurons and the genetics of schizophrenia. Biological Psychiatry. 2001;50(11):825–844. - PubMed
-
- Strasser HC, Lilyestrom J, Ashby ER, Honeycutt NA, Schretlen DJ, Pulver AE, Hopkins RO, Depaulo JR, Potash JB, Schweizer B, Yates KO, Kurian E, Barta PE, Pearlson GD. Hippocampal and ventricular volumes in psychotic and nonpsychotic bipolar patients compared with schizophrenia patients and community control subjects: A pilot study. Biological Psychiatry. 2005;57(6):633–639. - PubMed
-
- Seghouane AK, Bekara M. A small sample model selection criterion based on Kullback's symmetric divergence. IEEE Trans. Signal Processing. 2004;52(12):3314–3323.
Publication types
MeSH terms
Grants and funding
LinkOut - more resources
Full Text Sources
Other Literature Sources
Medical
