Convex optimization of coincidence time resolution for a high-resolution PET system
- PMID: 20876008
- PMCID: PMC3693485
- DOI: 10.1109/TMI.2010.2080282
Convex optimization of coincidence time resolution for a high-resolution PET system
Abstract
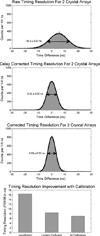
We are developing a dual panel breast-dedicated positron emission tomography (PET) system using LSO scintillators coupled to position sensitive avalanche photodiodes (PSAPD). The charge output is amplified and read using NOVA RENA-3 ASICs. This paper shows that the coincidence timing resolution of the RENA-3 ASIC can be improved using certain list-mode calibrations. We treat the calibration problem as a convex optimization problem and use the RENA-3's analog-based timing system to correct the measured data for time dispersion effects from correlated noise, PSAPD signal delays and varying signal amplitudes. The direct solution to the optimization problem involves a matrix inversion that grows order (n(3)) with the number of parameters. An iterative method using single-coordinate descent to approximate the inversion grows order (n). The inversion does not need to run to convergence, since any gains at high iteration number will be low compared to noise amplification. The system calibration method is demonstrated with measured pulser data as well as with two LSO-PSAPD detectors in electronic coincidence. After applying the algorithm, the 511 keV photopeak paired coincidence time resolution from the LSO-PSAPD detectors under study improved by 57%, from the raw value of 16.3 ±0.07 ns full-width at half-maximum (FWHM) to 6.92 ±0.02 ns FWHM ( 11.52 ±0.05 ns to 4.89 ±0.02 ns for unpaired photons).
Figures


Similar articles
-
Effects of system geometry and other physical factors on photon sensitivity of high-resolution positron emission tomography.Phys Med Biol. 2007 Jul 7;52(13):3753-72. doi: 10.1088/0031-9155/52/13/007. Epub 2007 May 29. Phys Med Biol. 2007. PMID: 17664575 Free PMC article.
-
Effects of multiple-interaction photon events in a high-resolution PET system that uses 3-D positioning detectors.Med Phys. 2010 Oct;37(10):5494-508. doi: 10.1118/1.3483262. Med Phys. 2010. PMID: 21089785 Free PMC article.
-
A study of the timing properties of position-sensitive avalanche photodiodes.Phys Med Biol. 2009 Sep 7;54(17):5155-72. doi: 10.1088/0031-9155/54/17/006. Epub 2009 Aug 11. Phys Med Biol. 2009. PMID: 19671971 Free PMC article.
-
Study of the performance of a novel 1 mm resolution dual-panel PET camera design dedicated to breast cancer imaging using Monte Carlo simulation.Med Phys. 2007 Feb;34(2):689-702. doi: 10.1118/1.2409480. Med Phys. 2007. PMID: 17388187 Free PMC article.
-
Thermal regulation of tightly packed solid-state photodetectors in a 1 mm(3) resolution clinical PET system.Med Phys. 2015 Jan;42(1):305-13. doi: 10.1118/1.4903889. Med Phys. 2015. PMID: 25563270 Free PMC article.
Cited by
-
A Study of Position-Sensitive Solid-State Photomultiplier Signal Properties.IEEE Trans Nucl Sci. 2014 Jun 12;61(3):1074-1083. doi: 10.1109/TNS.2014.2302635. IEEE Trans Nucl Sci. 2014. PMID: 25473125 Free PMC article.
-
New-generation small animal positron emission tomography system for molecular imaging.J Med Imaging (Bellingham). 2017 Jan;4(1):011008. doi: 10.1117/1.JMI.4.1.011008. Epub 2017 Jan 12. J Med Imaging (Bellingham). 2017. PMID: 28097211 Free PMC article.
-
Study of electrode pattern design for a CZT-based PET detector.Phys Med Biol. 2014 Jun 7;59(11):2599-621. doi: 10.1088/0031-9155/59/11/2599. Epub 2014 May 1. Phys Med Biol. 2014. PMID: 24786208 Free PMC article.
-
Promising new photon detection concepts for high-resolution clinical and preclinical PET.J Nucl Med. 2012 Feb;53(2):167-70. doi: 10.2967/jnumed.110.084343. J Nucl Med. 2012. PMID: 22302960 Free PMC article. Review.
-
Analog signal multiplexing for PSAPD-based PET detectors: simulation and experimental validation.Phys Med Biol. 2010 Dec 7;55(23):7149-74. doi: 10.1088/0031-9155/55/23/001. Epub 2010 Nov 16. Phys Med Biol. 2010. PMID: 21081831 Free PMC article.
References
-
- Olcott PD, Lau FWY, Levin CS. Data acquisition system design for a 1 mm3 resolution PSAPD-based pet system, 2007 IEEE Nucl. Sci. Symp. Conf. Rec. 2007:3206–3211.
-
- Levin CS. New imaging technologies to enhance the molecular sensitivity of positron emission tomography. Proc. IEEE. 2008 Mar;96(no. 3):439–467.
-
- Tumer TO, Cajipe VB, Clajus M, Hayakawa S, Volkovskii a. Multi-channel front-end readout IC for position sensitive solid-state detectors. 2006 IEEE Nucl. Sci. Symp. Conf. Rec.; Oct. 29–Nov.4 2006; San Diego, CA.
-
- Li w, Du y, Yanoff BD, Gordon JS. Energy resolution limiting factors of multi-pixel events in 3D position sensitive CZT gamma-ray spectrometer, 2008 IEEE Nucl. Sci. Symp. Conf. Rec. 2008:496–502.
Publication types
MeSH terms
Grants and funding
LinkOut - more resources
Full Text Sources
Miscellaneous

