. 2010 Oct 12;107(41):17674-9.
doi: 10.1073/pnas.1010178107. Epub 2010 Sep 27.

Genome-wide model for the normal eukaryotic DNA replication fork

Affiliations

Genome-wide model for the normal eukaryotic DNA replication fork

Andres A Larrea et al. Proc Natl Acad Sci U S A. .

Abstract

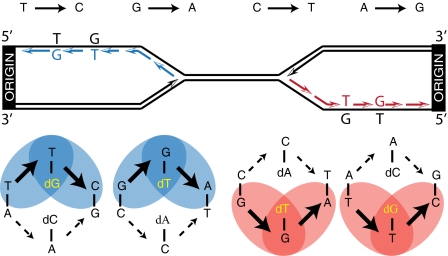
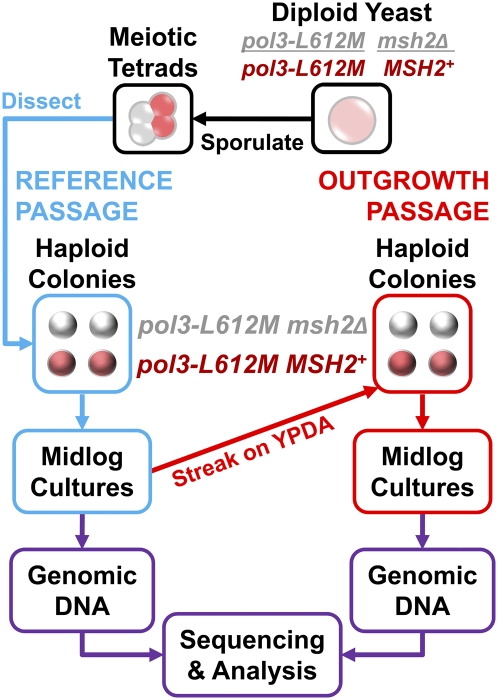
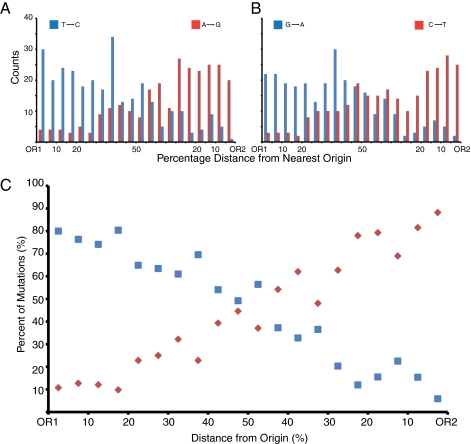
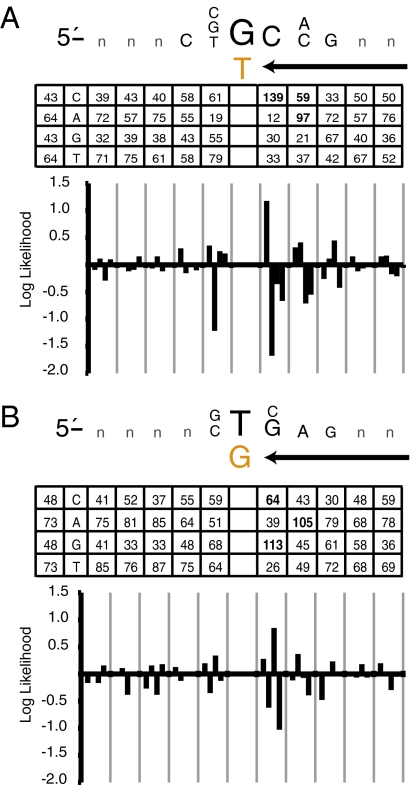
To investigate DNA replication enzymology across the nuclear genome of budding yeast, deep sequencing was used to establish the pattern of uncorrected replication errors generated by an asymmetric mutator variant of DNA polymerase δ (Pol δ). Sequencing of 16 genomes identified 1,206-bp substitutions generated over 33 generations by L612M Pol δ in a mismatch repair defective strain. Alignment of sequences flanking these substitutions identified "hotspot" motifs for Pol δ replication errors. The substitutions were distributed evenly across all 16 chromosomes. The vast majority were transitions that occurred with a strand bias that varied in a predictable manner relative to known functional origins of replication. This strand bias strongly supports the idea that Pol δ is primarily a lagging strand polymerase during replication across the entire nuclear genome.


Conflict of interest statement

The authors declare no conflict of interest.

Figures

Fig. 1.
Fig. 1.
Rationale to assign lagging strand replication errors to L612M Pol δ. This image depicts the predicted asymmetric distribution of the four transition mutations to the left and right of replication origins if L612M Pol δ replicates the lagging strand DNA template. See text for further description.
Fig. 2.
Fig. 2.
Protocol to obtain genomic DNA for sequence analysis. A diploid strain homozygous for pol3-L612M and heterozygous for deletion of MSH2 was sporulated to generate meiotic tetrads. These tetrads were dissected, and colonies resulting from the single-cell meiotic haploid products were grown overnight in 10 mL of YPDA medium. These cultures were added to 90 mL of YPDA medium and grown for 6 h to obtain ≈1010 cells, requiring ≈33 generations. This reference passage (blue path) is the period in which most or all of the mutations to be analyzed were generated. DNA obtained from this first passage, extracted from the whole population and, thus, representing the baseline haploid cells that emerged from tetrad dissection, served as the reference genome for each clone. Single colonies were obtained from these cultures by streaking out on YPDA plates, followed by a second round of growth in liquid YPDA medium. This outgrowth passage (red path) served to isolate and amplify genomes that were subject to mutation during the reference passage. DNA was extracted and sequenced to determine the uncorrected Pol δ L612M replication errors that had accumulated during the first round of growth.
Fig. 3.
Fig. 3.
Results for sequence analysis of 40 genomes. Four single-mutant clones (pol2-L612M, mismatch proficient) and 16 double mutants (pol2-L612M msh2Δ) were analyzed. In each case, one reference and one outgrowth genome were sequenced, representing a total of 40 genomes that are displayed side-by-side as pairs. The genome ID numbers range from 1 to 41; ID 17 is missing because it was not used for this study. (A) Plot showing the average number of reads per nucleotide (Redundancy) for each genome. The dark gray bars show redundancy for each reference genome, whereas the adjacent light gray bars show the redundancy for the paired outgrowth genome. (B) This graph depicts the number of single-base substitutions that accumulated in the genomes during the reference passage (Fig. 2, blue path), as detected by comparing the reference genome with the outgrowth genome for each clone.
Fig. 4.
Fig. 4.
Distribution of base-pair substitutions in the yeast genome. (A) Saccharomyces cerevisiae chromosome 3. Black diamonds represent confirmed replication origins, and red lines represent the locations of the base substitutions identified in the 16 outgrowth double-mutant genomes. (B) View of all 16 yeast chromosomes with 274 confirmed replication origins and the 1,206 identified base substitutions. (C) Density of substitutions per 10 Kb among the 16 chromosomes.
Fig. 5.
Fig. 5.
Mutational asymmetry around replication origins. (A) T-to-C (blue) and A-to-G (red) mutations as a function of interorigin distance. The bins represent percentages rather than absolute numbers of nucleotides, because origins are not equally spaced throughout the genome and strand bias depends on relative fork rates from adjacent origins. (B) G-to-A (blue) and C-to-T (red) mutations as a function of interorigin distance. The analyses in A and B disregard variations in origin behavior. Accounting for these changes would only strengthen the conclusions by decreasing the background. (C) Percentage of all mutations in a bin that are G-to-A plus T-to-C (blue) compared with those that are A-to-G plus C-to-T (red).
Fig. 6.
Fig. 6.
Sequence motifs surrounding transition mutations. (A) The mutable motif depicted here is for the 214 G-to-A transitions inferred to result from misincorporation of dTMP opposite template G. In the inset table, the column of the far left shows the expected number of occurrences of C, A, G, and T, assuming a random distribution and given the base content of the yeast genome. The other columns list the observed numbers of occurrences of C, A, G, and T at each location among the 214 substitutions. The likelihood score contributions (natural log scale) for C, G, A, and T were plotted for the interval between −5 and +5, where position 0 is the error. The letters in the mutable motif correspond to positions where differences between expected and observed were statistically significant when calculated as described in Materials and Methods. (B) The same as in A, but for the 242 transitions inferred to result from misincorporation of dGMP opposite template T.

References

    1. Burgers PM. Polymerase dynamics at the eukaryotic DNA replication fork. J Biol Chem. 2009;284:4041–4045. - PMC - PubMed
    1. Pursell ZF, Isoz I, Lundström EB, Johansson E, Kunkel TA. Yeast DNA polymerase epsilon participates in leading-strand DNA replication. Science. 2007;317:127–130. - PMC - PubMed
    1. Nick McElhinny SA, Gordenin DA, Stith CM, Burgers PM, Kunkel TA. Division of labor at the eukaryotic replication fork. Mol Cell. 2008;30:137–144. - PMC - PubMed
    1. Kunkel TA, Burgers PM. Dividing the workload at a eukaryotic replication fork. Trends Cell Biol. 2008;18:521–527. - PMC - PubMed
    1. Poloumienko A, Dershowitz A, De J, Newlon CS. Completion of replication map of Saccharomyces cerevisiae chromosome III. Mol Biol Cell. 2001;12:3317–3327. - PMC - PubMed

Publication types

Substances