

Glatiramer acetate triggers PI3Kδ/Akt and MEK/ERK pathways to induce IL-1 receptor antagonist in human monocytes
- PMID: 20876102
- PMCID: PMC2955124
- DOI: 10.1073/pnas.1009443107
Glatiramer acetate triggers PI3Kδ/Akt and MEK/ERK pathways to induce IL-1 receptor antagonist in human monocytes
Abstract
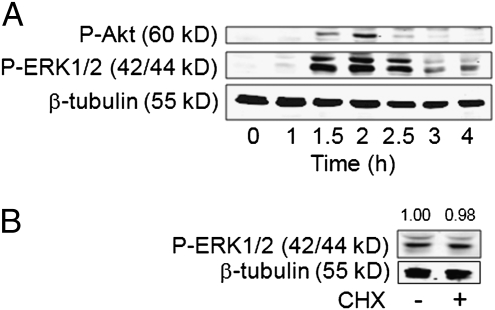
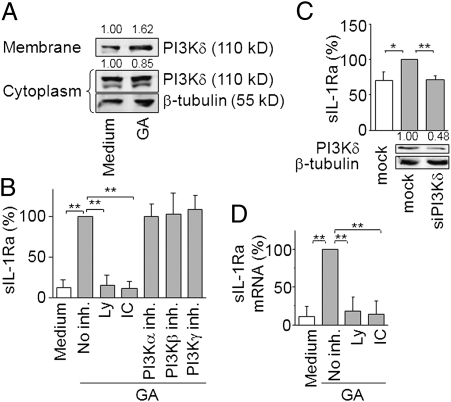
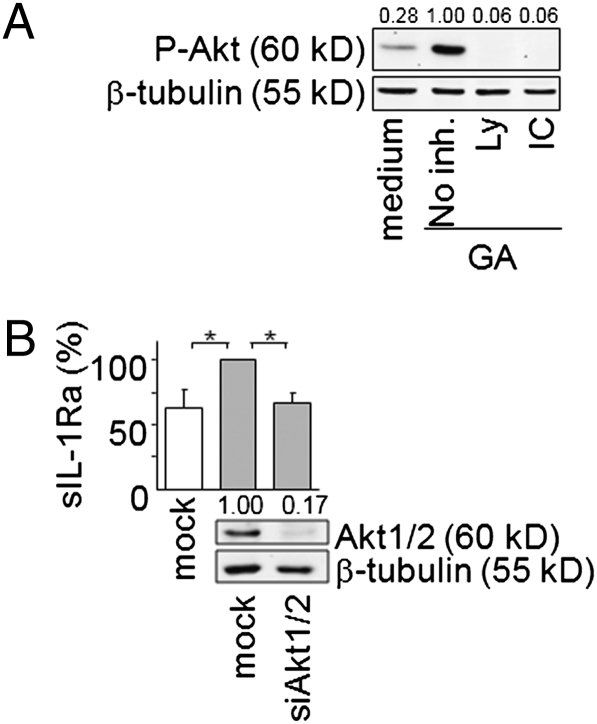
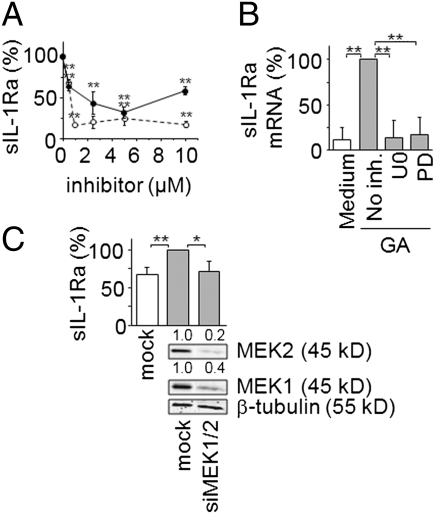
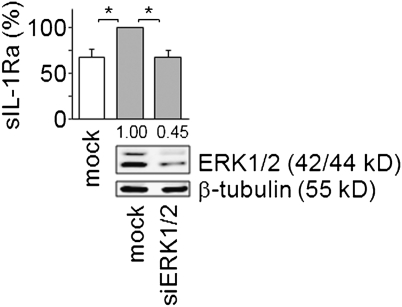
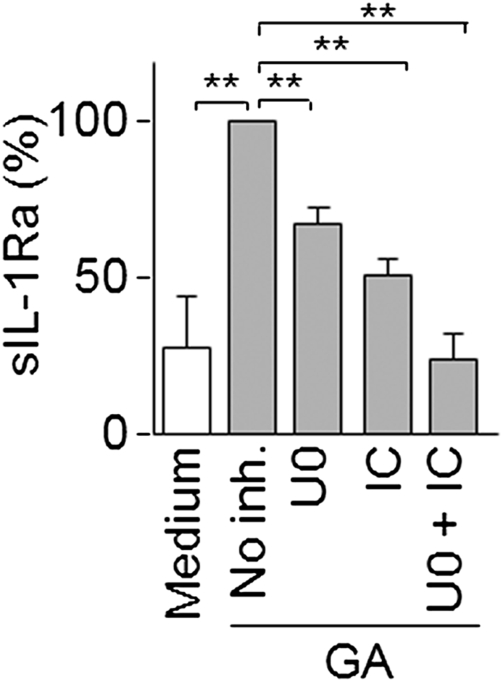
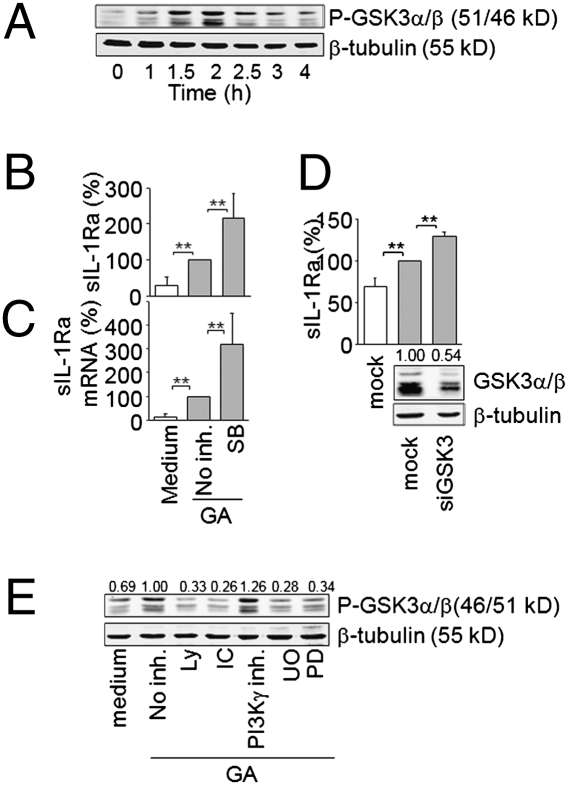
Glatiramer acetate (GA), an immunomodulator used in multiple sclerosis (MS) therapy, induces the production of secreted IL-1 receptor antagonist (sIL-1Ra), a natural inhibitor of IL-1β, in human monocytes, and in turn enhances sIL-1Ra circulating levels in MS patients. GA is a mixture of peptides with random Glu, Lys, Ala, and Tyr sequences of high polarity and hydrophilic nature that is unlikely to cross the blood-brain barrier. In contrast, sIL-1Ra crosses the blood-brain barrier and, in turn, may mediate GA anti-inflammatory activities within the CNS by counteracting IL-1β activities. Here we identify intracellular signaling pathways induced by GA that control sIL-1Ra expression in human monocytes. By using kinase knockdown and specific inhibitors, we demonstrate that GA induces sIL-1Ra production via the activation of PI3Kδ, Akt, MEK1/2, and ERK1/2, demonstrating that both PI3Kδ/Akt and MEK/ERK pathways rule sIL-1Ra expression in human monocytes. The pathways act in parallel upstream glycogen synthase kinase-3α/β (GSK3α/β), the knockdown of which enhances sIL-1Ra production. Together, our findings demonstrate the existence of signal transduction triggered by GA, further highlighting the mechanisms of action of this drug in MS.
Conflict of interest statement
The authors declare no conflict of interest.
Figures
Similar articles
-
IFNβ and glatiramer acetate trigger different signaling pathways to regulate the IL-1 system in multiple sclerosis.Commun Integr Biol. 2011 Jan;4(1):112-4. doi: 10.4161/cib.4.1.14205. Commun Integr Biol. 2011. PMID: 21509198 Free PMC article.
-
Glatiramer acetate increases IL-1 receptor antagonist but decreases T cell-induced IL-1beta in human monocytes and multiple sclerosis.Proc Natl Acad Sci U S A. 2009 Mar 17;106(11):4355-9. doi: 10.1073/pnas.0812183106. Epub 2009 Mar 2. Proc Natl Acad Sci U S A. 2009. PMID: 19255448 Free PMC article.
-
A novel MEK2/PI3Kδ pathway controls the expression of IL-1 receptor antagonist in IFN-β-activated human monocytes.J Leukoc Biol. 2010 Dec;88(6):1191-200. doi: 10.1189/jlb.0510312. Epub 2010 Sep 13. J Leukoc Biol. 2010. PMID: 20837746
-
Opposite regulation of IL-1beta and secreted IL-1 receptor antagonist production by phosphatidylinositide-3 kinases in human monocytes activated by lipopolysaccharides or contact with T cells.J Immunol. 2007 Jan 1;178(1):446-54. doi: 10.4049/jimmunol.178.1.446. J Immunol. 2007. PMID: 17182583
-
Glatiramer acetate: mechanisms of action in multiple sclerosis.Autoimmun Rev. 2007 Aug;6(7):469-75. doi: 10.1016/j.autrev.2007.02.003. Epub 2007 Mar 6. Autoimmun Rev. 2007. PMID: 17643935 Review.
Cited by
-
IFNβ and glatiramer acetate trigger different signaling pathways to regulate the IL-1 system in multiple sclerosis.Commun Integr Biol. 2011 Jan;4(1):112-4. doi: 10.4161/cib.4.1.14205. Commun Integr Biol. 2011. PMID: 21509198 Free PMC article.
-
B-cell targeting agents in the treatment of multiple sclerosis.Curr Treat Options Neurol. 2013 Jun;15(3):259-69. doi: 10.1007/s11940-013-0232-y. Curr Treat Options Neurol. 2013. PMID: 23609780 Free PMC article.
-
Induction of a higher-ordered architecture in glatiramer acetate improves its biological efficiency in an animal model of multiple sclerosis.Biomater Sci. 2020 Sep 30;8(19):5271-5281. doi: 10.1039/d0bm00957a. Biomater Sci. 2020. PMID: 32744547 Free PMC article.
-
Comparing the biological impact of glatiramer acetate with the biological impact of a generic.PLoS One. 2014 Jan 8;9(1):e83757. doi: 10.1371/journal.pone.0083757. eCollection 2014. PLoS One. 2014. PMID: 24421904 Free PMC article.
-
New Insights into the Role of IL-1β in Experimental Autoimmune Encephalomyelitis and Multiple Sclerosis.J Immunol. 2017 Jun 15;198(12):4553-4560. doi: 10.4049/jimmunol.1700263. J Immunol. 2017. PMID: 28583987 Free PMC article. Review.
References
-
- Burger D, Dayer JM. In: Cytokine Reference. Oppenheim JJ, Feldmann M, editors. London: Academic Press; 2000. pp. 319–336.
-
- Dinarello CA. The role of the interleukin-1-receptor antagonist in blocking inflammation mediated by interleukin-1. N Engl J Med. 2000;343:732–734. - PubMed
-
- Burger D, Dayer JM, Palmer G, Gabay C. Is IL-1 a good therapeutic target in the treatment of arthritis? Best Pract Res Clin Rheumatol. 2006;20:879–896. - PubMed
-
- Arend WP, Palmer G, Gabay C. IL-1, IL-18, and IL-33 families of cytokines. Immunol Rev. 2008;223:20–38. - PubMed
Publication types
MeSH terms
Substances
LinkOut - more resources
Full Text Sources
Other Literature Sources
Medical
Miscellaneous
