. 2010 Oct 19;107(42):18034-9.
doi: 10.1073/pnas.1004666107. Epub 2010 Sep 27.

Genomic patterns of pleiotropy and the evolution of complexity

Affiliations

Genomic patterns of pleiotropy and the evolution of complexity

Zhi Wang et al. Proc Natl Acad Sci U S A. .

Abstract

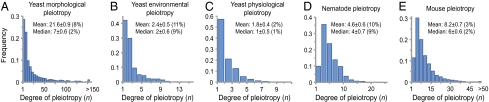
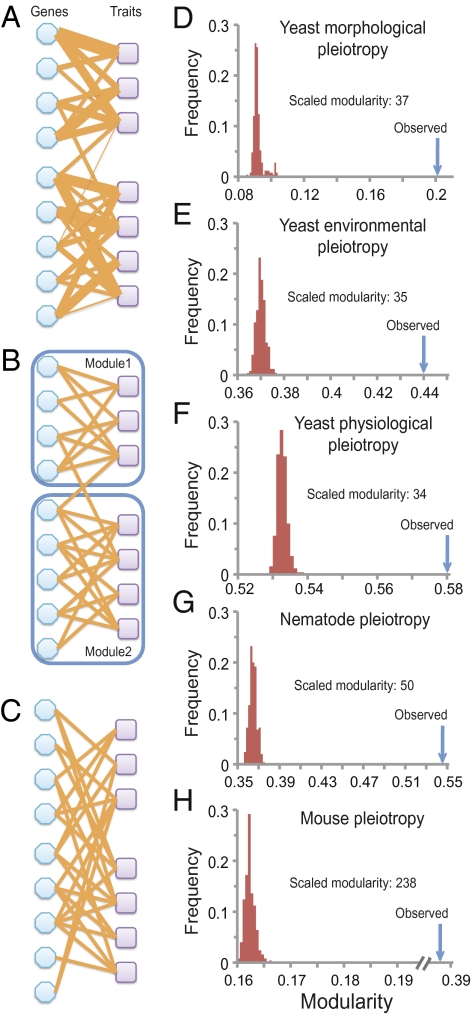
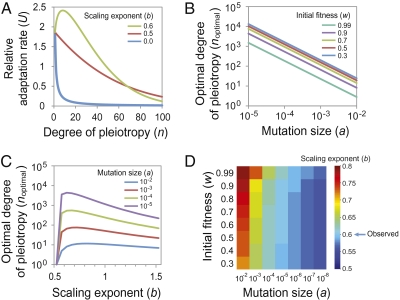
Pleiotropy refers to the phenomenon of a single mutation or gene affecting multiple distinct phenotypic traits and has broad implications in many areas of biology. Due to its central importance, pleiotropy has also been extensively modeled, albeit with virtually no empirical basis. Analyzing phenotypes of large numbers of yeast, nematode, and mouse mutants, we here describe the genomic patterns of pleiotropy. We show that the fraction of traits altered appreciably by the deletion of a gene is minute for most genes and the gene-trait relationship is highly modular. The standardized size of the phenotypic effect of a gene on a trait is approximately normally distributed with variable SDs for different genes, which gives rise to the surprising observation of a larger per-trait effect for genes affecting more traits. This scaling property counteracts the pleiotropy-associated reduction in adaptation rate (i.e., the "cost of complexity") in a nonlinear fashion, resulting in the highest adaptation rate for organisms of intermediate complexity rather than low complexity. Intriguingly, the observed scaling exponent falls in a narrow range that maximizes the optimal complexity. Together, the genome-wide observations of overall low pleiotropy, high modularity, and larger per-trait effects from genes of higher pleiotropy necessitate major revisions of theoretical models of pleiotropy and suggest that pleiotropy has not only allowed but also promoted the evolution of complexity.


Conflict of interest statement

The authors declare no conflict of interest.

Figures

Fig. 1.
Fig. 1.
Frequency distributions of degree of gene pleiotropy in (A) yeast morphological, (B) yeast environmental, (C) yeast physiological, (D) nematode, and (E) mouse pleiotropy data. Mean and median degrees of pleiotropy and their SDs are indicated. The numbers in parentheses are the mean and median degrees of pleiotropy divided by the total number of traits. After the removal of genes that do not affect any trait and traits that are not affected by any gene, the total numbers of genes and traits in these datasets are (A) 2,449 genes and 253 traits, (B) 774 genes and 22 traits, (C) 1,256 genes and 120 traits, (D) 661 genes and 44 traits, and (E) 4,915 genes and 308 traits.
Fig. 2.
Fig. 2.
High modularity of gene–trait bipartite networks. (A) A hypothetical gene–trait bipartite network. A link between a gene and a trait indicates that the gene affects the trait, and the thickness of the link indicates the effect size. (B) Two modules are identified in the hypothetical gene–trait network after the quantitative links are transformed to qualitative links (i.e., presence/absence) on the basis of whether an effect size is significantly different from 0. (C) A randomly rewired network that has the same degree distribution as the original hypothetical network shows no detectable modular structure. The modularity and scaled modularity of the hypothetical bipartite network are 0.41 and 3.9, respectively. DH show the observed modularity (blue arrows) and distribution of modularity for 250 randomly rewired networks (red histograms) for the gene–trait networks of the (D) yeast morphological, (E) yeast environmental, (F) yeast physiological, (G) nematode, and (H) mouse pleiotropy datasets.
Fig. 3.
Fig. 3.
Scaling relationships between the total phenotypic effect size of a gene and the degree of pleiotropy in the yeast morphological pleiotropy data. (A) Examples showing the normal distribution of effect size over 279 traits. Two genes are chosen to show variable SDs of the normal distributions. (B) Distribution of the SD of the effect size for all 4,718 genes. Observed scaling relationships between the degree of pleiotropy n and the total phenotypic effect of a gene are measured by (C) Euclidean distance or (D) Manhattan distance. The orange curve is the best fit to the power function whose estimated parameters are shown in the upper left. The numbers after ± show the 95% confidence interval for the estimated scaling exponent. R2 indicates the square of the correlation coefficient. E and F are similar to C and D except that the effect sizes of each gene are randomly generated from a normal distribution with zero mean and observed SD. G and H are similar to C and D except that the effect sizes of each gene are randomly generated from a normal distribution with zero mean and a constant SD, which is the average of all SDs of all genes.
Fig. 4.
Fig. 4.
The “cost of complexity” is alleviated when the scaling exponent b > 0.5. (A) The relative adaptation rate as a function of the degree of pleiotropy (n) changes with the scaling exponent b. The relative adaptation rate is calculated using Orr's formula. The initial fitness w is set at 0.9 and the mutation size a is set at 0.01. (B) The optimal degree of pleiotropy noptimal, defined as the degree of pleiotropy that corresponds to the highest adaptation rate, changes with the mutation size a. Different curves are generated using different initial fitness (w) values but the same b = 0.6. (C) The optimal degree of pleiotropy noptimal changes with different b. Different curves are generated using different a but the same w = 0.9. (D) A heat map showing the b value that provides the maximal noptimal, given a and w.

Similar articles

Cited by

References

    1. Tyler AL, Asselbergs FW, Williams SM, Moore JH. Shadows of complexity: What biological networks reveal about epistasis and pleiotropy. BioEssays. 2009;31:220–227. - PMC - PubMed
    1. Wright S. Evolution and the Genetics of Populations. Chicago: Univ of Chicago Press; 1968.
    1. Barton NH. Pleiotropic models of quantitative variation. Genetics. 1990;124:773–782. - PMC - PubMed
    1. Hodgkin J. Seven types of pleiotropy. Int J Dev Biol. 1998;42:501–505. - PubMed
    1. Carroll SB. Evo-devo and an expanding evolutionary synthesis: A genetic theory of morphological evolution. Cell. 2008;134:25–36. - PubMed

Publication types

LinkOut - more resources