. 2010 Oct 12;107(41):17563-8.
doi: 10.1073/pnas.1006340107. Epub 2010 Sep 27.

Structural basis for glucose-6-phosphate activation of glycogen synthase

Affiliations

Structural basis for glucose-6-phosphate activation of glycogen synthase

Sulochanadevi Baskaran et al. Proc Natl Acad Sci U S A. .

Abstract

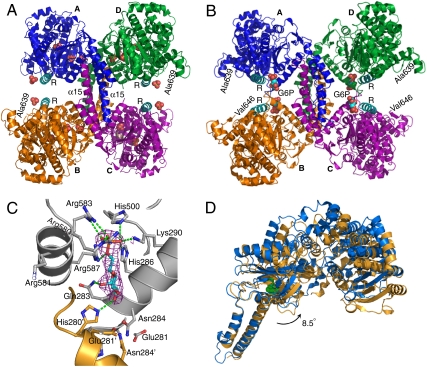
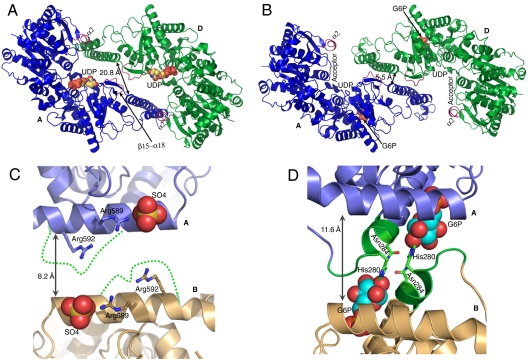
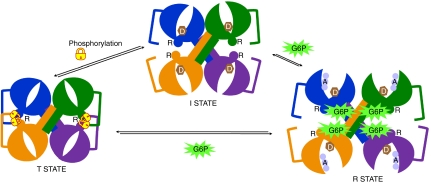
Regulation of the storage of glycogen, one of the major energy reserves, is of utmost metabolic importance. In eukaryotes, this regulation is accomplished through glucose-6-phosphate levels and protein phosphorylation. Glycogen synthase homologs in bacteria and archaea lack regulation, while the eukaryotic enzymes are inhibited by protein kinase mediated phosphorylation and activated by protein phosphatases and glucose-6-phosphate binding. We determined the crystal structures corresponding to the basal activity state and glucose-6-phosphate activated state of yeast glycogen synthase-2. The enzyme is assembled into an unusual tetramer by an insertion unique to the eukaryotic enzymes, and this subunit interface is rearranged by the binding of glucose-6-phosphate, which frees the active site cleft and facilitates catalysis. Using both mutagenesis and intein-mediated phospho-peptide ligation experiments, we demonstrate that the enzyme's response to glucose-6-phosphate is controlled by Arg583 and Arg587, while four additional arginine residues present within the same regulatory helix regulate the response to phosphorylation.


Conflict of interest statement

The authors declare no conflict of interest.

Figures

Fig. 1.
Fig. 1.
Structures of the basal and activated states of Gsy2p. (A) Ribbon diagram of the basal state conformation in which the individual subunits are labeled (A–D) and colored separately. The regulatory helices (α22) are colored cyan and labeled R, while the intersubunit helices are labeled α15 as is the last ordered residue at the C terminus of subunits B and D. Ordered sulfate ions in this structure are represented using space filling atoms. (B) Ribbon diagram of the activated state of Gsy2p. The color scheme, subunit, and regulatory helix labeling is identical to panel A. The bound glucose-6-phosphate molecules at the interface are represented using space filling atoms and labeled G6P. (C) Glucose-6-phosphate binding site in Gsy2p. Glucose-6-phosphate and the surrounding amino acid residues are represented using ball-and-stick models and displayed using atom type coloring. Elements from distinct subunits are labeled and denoted with separate ribbon and carbon atom coloring. The electron density map displayed is the original 2Fo-Fc map (contoured at 1 standard deviation) for glucose-6-phosphate prior to its inclusion in the structural model. The local hydrogen bonding pattern is represented using dashed green lines. (D) Ribbon representation of the superposed basal state and activated state monomers. The glucose-6-phosphate molecule bound to the activated state structure (blue) is represented using green space filling atoms. The alignment was generated by superposing helices α15 and α16 (residues 365–399 and 416–434) using the program superpose in the CCP4 suite (21). [Produced using Pymol (23) for Windows.]
Fig. 2.
Fig. 2.
Comparison of the basal and activated state conformations. (A) Ribbon representation of the AD dimer pair in the basal state with bound UDP represented using space filling atoms and ribbon coloring identical to Fig. 1A. The loop region β15-α18 and helix α2 are highlighted in purple and labeled. The distance between equivalent positions of the α15 helices is provided. (B) Ribbon representation of the AD dimer pair in the activated state using the same coloring scheme as in panel A. The glucose-6-phosphate molecules are represented using space filling atoms and labeled, as are the relative positions of UDP and structural elements contributing to glycogen acceptor binding. (C) Ribbon representation of the regulatory interface between subunits A and B in the basal state. The individual subunits are indicated with labels and distinct ribbon colors. The bound sulfate molecule near the N terminus of each regulatory helix is displayed using space filling atoms. The disordered region between residues 277–285 is represented as a dashed green line solely to indicate the connectivity. (D) Ribbon representation of the regulatory helix interface between subunits A and B in the activated state of the R589A/R592A mutant. The coloring scheme is identical to that in panel C and the bound glucose-6-phosphate is displayed using space filling atoms. The residues interacting with glucose-6-phosphate from the 277–285 loop region are represented using green coloring. [Produced using Pymol (23) for Windows.]
Fig. 3.
Fig. 3.
Schematic representation of the conformational states underlying regulation of Gsy2p activity. The individual subunits are colored according to the coloring scheme in Fig. 1. The regulatory helices containing the arginines are labeled R and the approximate positions of nucleotide-donor sugar (D) and glycogen acceptor (A) are shown for the I- and R-states, respectively. Phosphorylation of Thr668 is shown as “locking” the enzyme in the T-state conformation through intersubunit interactions across the regulatory interface. Glucose-6-phosphate binding frees these constraining interactions to fully activate the enzyme in the R-state conformation.

Similar articles

Cited by

References

    1. Roach PJ. Glycogen and its metabolism. Curr Mol Med. 2002;2(2):101–120. - PubMed
    1. Villar-Palasi C, Larner J. Insulin-mediated effect on the activity of UDPG-glycogen transglucosylase of muscle. Biochim Biophys Acta. 1960;39:171–173. - PubMed
    1. Sheng F, Jia X, Yep A, Preiss J, Geiger JH. The crystal structures of the open and catalytically competent closed conformation of Escherichia coli glycogen synthase. J Biol Chem. 2009;284(26):17796–17807. - PMC - PubMed
    1. Buschiazzo A, et al. Crystal structure of glycogen synthase: Homologous enzymes catalyze glycogen synthesis and degradation. EMBO J. 2004;23(16):3196–3205. - PMC - PubMed
    1. Horcajada C, Guinovart JJ, Fita I, Ferrer JC. Crystal structure of an archaeal glycogen synthase: Insights into oligomerization and substrate binding of eukaryotic glycogen synthases. J Biol Chem. 2006;281(5):2923–2931. - PubMed

Publication types