Comparative Study
. 2010 Nov 15;588(Pt 22):4489-505.
doi: 10.1113/jphysiol.2010.197012. Epub 2010 Sep 27.

Monosynaptic excitatory inputs to spinal lamina I anterolateral-tract-projecting neurons from neighbouring lamina I neurons

Affiliations
Comparative Study

Monosynaptic excitatory inputs to spinal lamina I anterolateral-tract-projecting neurons from neighbouring lamina I neurons

Liliana L Luz et al. J Physiol. .

Abstract

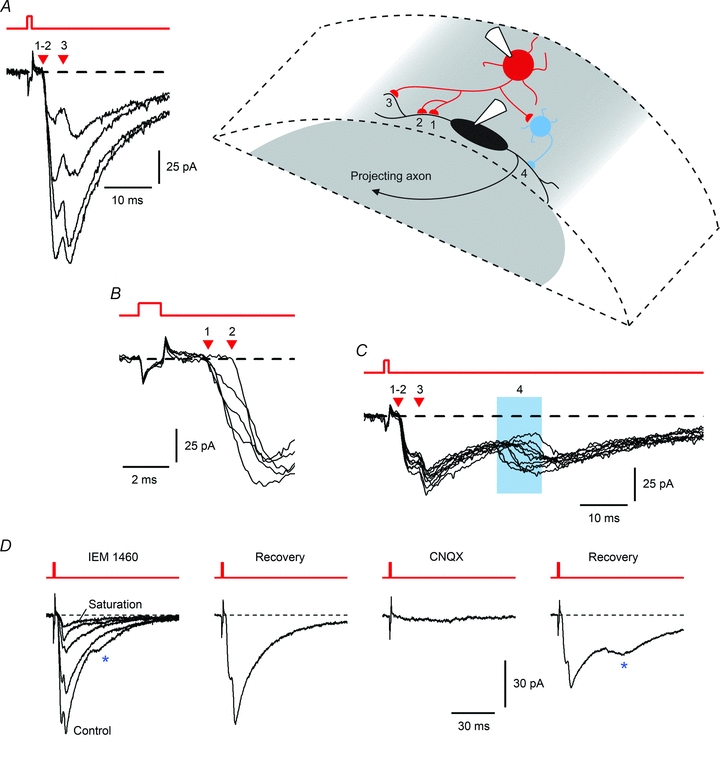
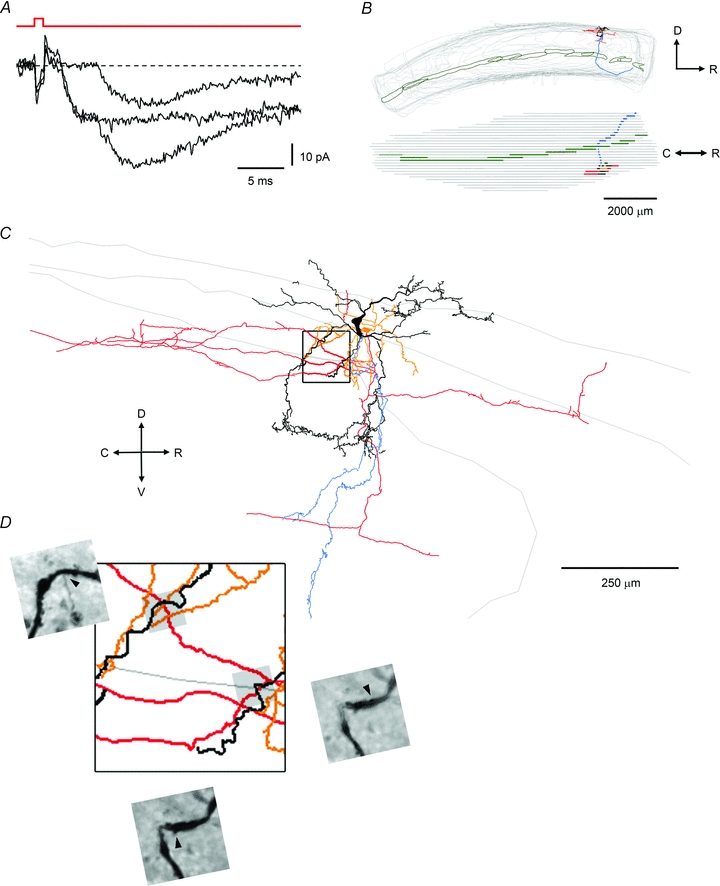
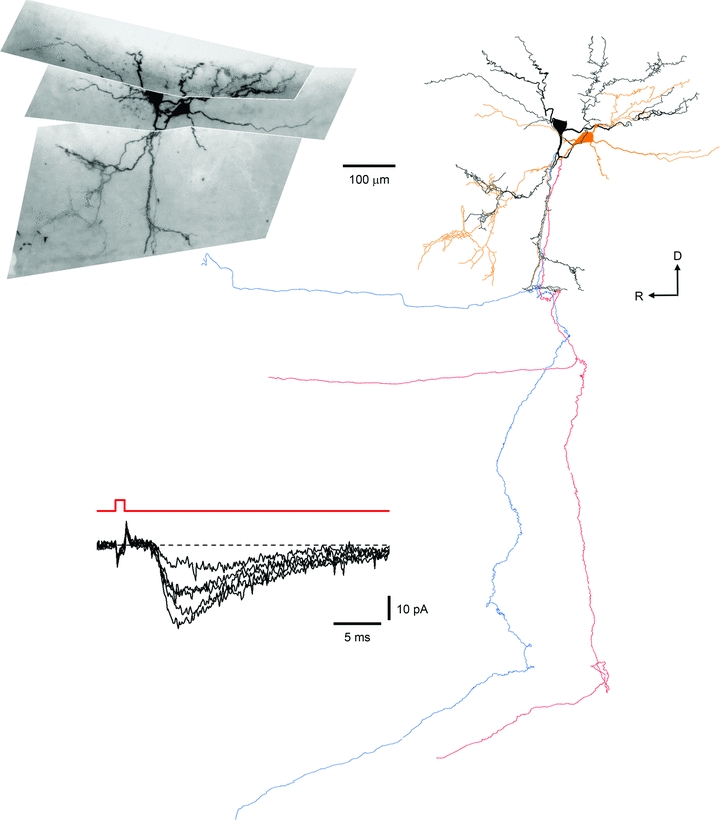
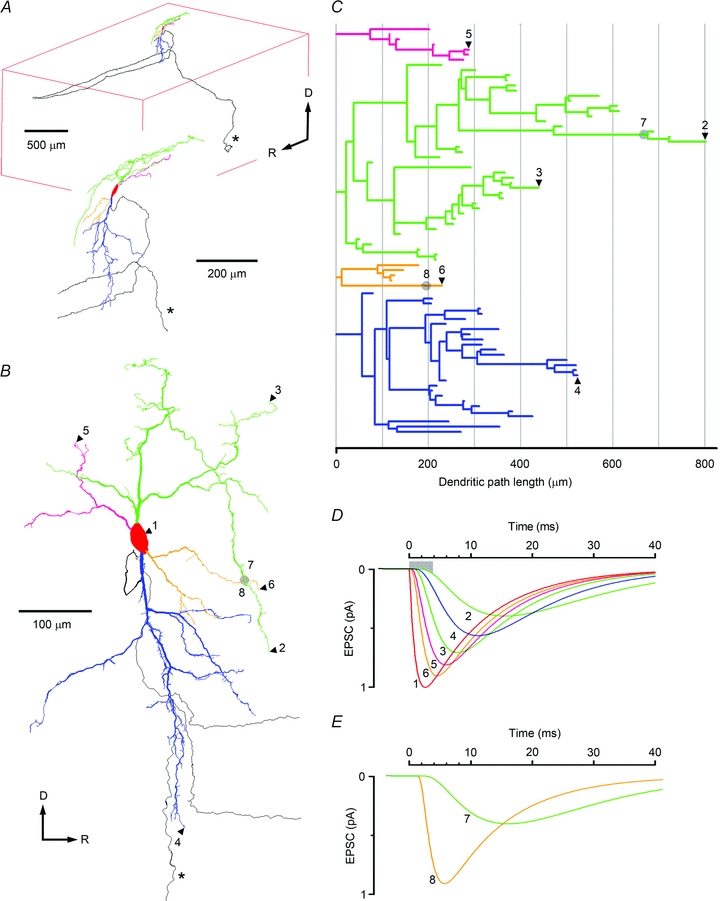
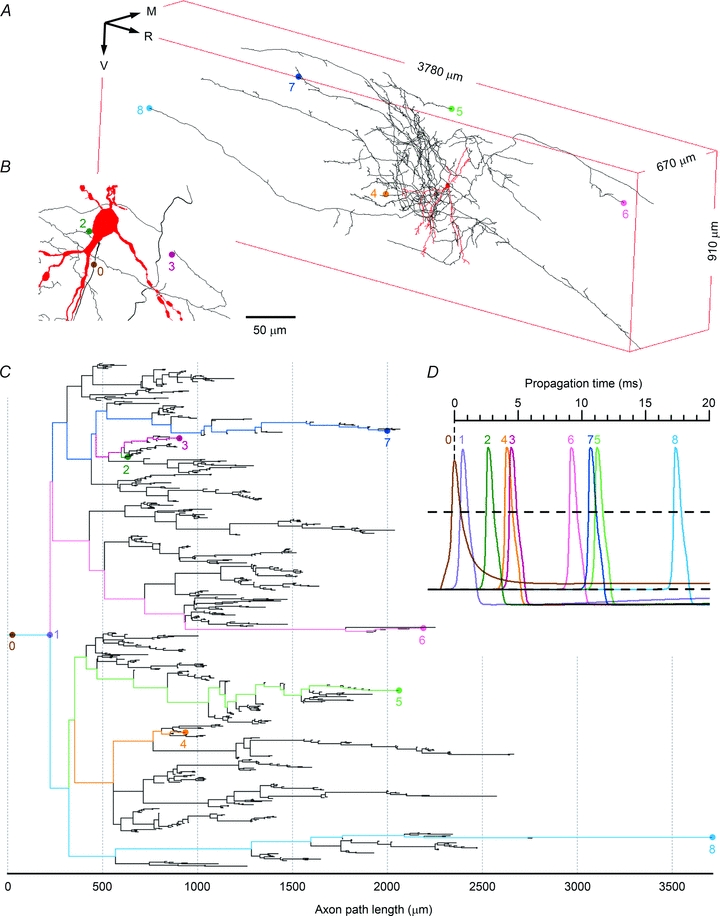
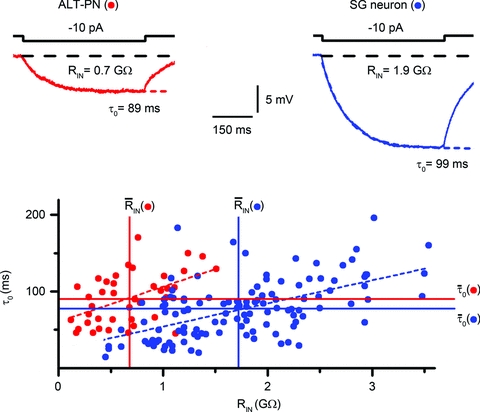
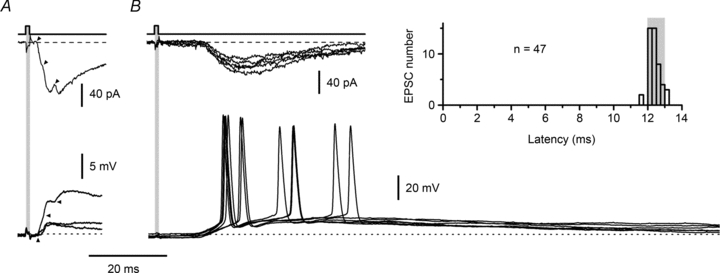
Spinal lamina I receives nociceptive primary afferent input to project through diverse ascending pathways, including the anterolateral tract (ALT). Large projection neurons (PNs) form only a few per cent of the cell population in this layer, and little is known about their local input from other lamina I neurons. We combined single-cell imaging in the isolated spinal cord, paired recordings, 3-D reconstructions of biocytin-labelled neurons and computer simulations to study the monosynaptic input to large ALT-PNs from neighbouring (somata separated by less than 80 μm) large lamina I neurons. All 11 connections identified were excitatory. We have found that an axon of a presynaptic neuron forms multiple synapses on an ALT-PN, and both Ca(2+)-permeable and Ca(2+)-impermeable AMPA receptors are involved in transmission. The monosynaptic EPSC latencies (1-12 ms) are determined by both post- and presynaptic factors. The postsynaptic delay, resulting from the electrotonic EPSC propagation in the dendrites of an ALT-PN, could be 4 ms at most. The presynaptic delay, caused by the spike propagation in a narrow highly branched axon of a local-circuit neuron, can be about 10 ms for neighbouring ALT-PNs and longer for more distant neurons. In many cases, the EPSPs evoked by release from a lamina I neuron were sufficient to elicit a spike in an ALT-PN. Our data show that ALT-PNs can receive input from both lamina I local-circuit neurons and other ALT-PNs. We suggest that lamina I is a functionally interconnected layer. The intralaminar network described here can amplify the overall output from the principal spinal nociceptive projection area.


Figures

Figure 1
Figure 1. Recording from large lamina I neurons in the isolated spinal cord
A, preparation of the lumbar spinal cord for recordings from pairs of synaptically connected lamina I neurons. An infrared LED was used as a source of oblique illumination for the cell imaging. Both pre- and postsynaptic neurons were located in the region between the dorsolateral funiculus (lateral border) and the dorsal root entry zone (medial border). A post hoc analysis of the major axon course was done to prove that the postsynaptic neuron was an ALT-PN. B, types of large somata of lamina I neurons seen under our experimental conditions. The 3-D reconstructions (bottom) were done from 5–10 serial images (top) taken in different focal planes (∼2 μm step). Contour lines of a soma and initial dendrites were traced in individual images into a 3-D modelling software (Cinema-4D, Maxon). a, a polygonal flattened soma (dorsoventral extent, ∼10 μm) with three or four major dendrites. This cell body resembled those of flattened neurons (Lima & Coimbra, 1986). b, a pyramidal soma with four dendrites leaving from the apices similar to that of a pyramidal neuron (Lima & Coimbra, 1986). c, a spindle-shaped soma with dendrites in a bipolar organization resembling those of fusiform cells (Lima & Coimbra, 1986). d, a soma appearing as a sphere (diameter, ∼20 μm) with numerous, sometimes poorly visible, dendrites; similar to the body of multipolar cells (Lima & Coimbra, 1986). All ALT-PNs (n = 40) had somata of the first three types, while the presynaptic neurons had frequently somata of the fourth type. M, medial; C, caudal.
Figure 3
Figure 3. A monosynaptic connection with transmitter release in multiple synapses and activation of CP- and CI-AMPARs
Recordings from a connection with a postsynaptic ALT-PN. The axon of the presynaptic neuron (red) released transmitter in multiple synapses. A, the shorter- and longer-latency components of a composite monosynaptic EPSC. Four non-consecutive traces show the EPSC amplitude variation caused by fluctuation of the quantal transmitter release. The longer-latency component corresponded to activation of more remote synapse 3. B, fast transitions on the rising phase of the shorter-latency component. Two subcomponents corresponding to activation of synapses 1 and 2 could be activated either individually (no transitions) or together (traces with transitions) (5 non-consecutive traces). C, 10 consecutive traces showing a polysynaptic EPSC (synapse 4). Note the lack of failures. A large latency variation (indicated by a blue box) was caused by the variation in the spike initiation time in the intercalated neuron (blue) as described by Santos et al. (2009). Laminar location of the intercalated neuron could not be determined. D, both CP- and CI-AMPARs are involved in transmission in this connection. Effects of 20 μm IEM 1460 (CP-AMPAR blocker) and 10 μm CNQX (AMPA/kainate receptor blocker) are shown for averaged traces (each obtained from 10 consecutive episodes recoded at 1 Hz). For IEM 1460, development of the block is shown. Note that monosynaptic EPSCs (corresponding to synapses 1–2 and 3) are progressively reduced, while the polysynaptic one (synapse 4, indicated by an asterisk) disappears abruptly. Because of the variable latency, the polysynaptic EPSC appears smaller in the averaged trace. The polysynaptic component was recovered only after a long wash-out at the end of the experiment.
Figure 4
Figure 4. Inputs to an ALT-PN from a lamina I local-circuit neuron
A, monosynaptic EPSCs with at least two components. Non-consecutive traces were chosen to show individual components and the composite EPSC. B, 2-D reconstruction from serial sections showing the major axon (blue) of the postsynaptic ALT-PN (soma and dendrites, black) reaching the rostral end of the spinal cord preparation. The presynaptic neuron: orange, soma and dendrites; red, axon. Upper part, a lateral view; lower part, a horizontal view (green line indicates the central canal). R, rostral; C, caudal; V, ventral; D, dorsal. Grey lines in B and C indicate the contours of the bottom of the serial sections. For clarity, some contour lines were omitted. C, the postsynaptic ALT-PN was a pyramidal neuron of the ventral-collateral-type. The presynaptic cell was a lamina I local-circuit neuron (multipolar type-IIa) with axon arborizations occupying the SDH of one entire segment. The region in the inset is shown amplified in D. D, three close appositions between the presynaptic axon and the postsynaptic dendrites were revealed (arrowheads). Two of them were formed by the same axon branch (right group).
Figure 5
Figure 5. Input to an ALT-PN from another ALT-PN
Microphotographs (from different sections) and the 2-D reconstruction of two ALT-PNs (pyramidal neurons of the lateral-collateral-type). Postsynaptic neuron; soma and dendrites, black; axon, blue. Presynaptic neuron: soma and dendrites, orange; axon, red. The evoked EPSC showed only one component (5 consecutive traces). R, rostral; D, dorsal.
Figure 7
Figure 7. EPSC propagation in the postsynaptic ALT-PN
A, the 3-D reconstruction of the dendrites and axon of an ALT-PN of the lateral-collateral-type. Perspective overview of the neuron depicting the orientation and course of the projecting axon and collaterals. Higher magnification image demonstrates major dendrites restricted to lamina I following the curvature of the dorsal horn surface. The projecting axon is indicated by an asterisk. Four major dendrites are shown by different colours. B, sagittal projection of the reconstructed neuron. Simulations were done for synapses (1–8) inserted on places indicated by arrowheads or a grey circle. C, dendrogram (the same colour code and synapse identification numbers as in B). D, simulations of the somatic voltage-clamp recording of the EPSCs evoked by activation of the corresponding synapses. The delays were measured as a time interval between the transmitter release (0 ms) and the moment when the corresponding EPSC reached 10% of its peak amplitude (shown by a grey bar for the slowest EPSC). E, EPSCs arising from two spatially close synapses (7 and 8) located in different major dendrites.
Figure 8
Figure 8. Spike propagation in the axon of a local-circuit neuron
A, the 3-D reconstruction of the axon (black) and dendrites (red) of a large lamina I local-circuit neuron filled with biocytin in whole-cell mode. The highest order of the axon branches was 26. The axon had 647 endings and 4588 varicosities. Note that some of the longest branches were truncated. Axonal points for which the spike propagation simulation was done are labelled by coloured circles. B, higher magnification image demonstrating the axon (black) in the vicinity of the soma (red). The axon originated from a primary dendrite (red). In simulation, the spike was initiated in the primary axon at point 0 (stimulation was applied to the soma). C, axogram with indication of simulation points and their axon paths (indicated by the corresponding colours). The common parts of the axon paths are shown by the colour of the longer path. D, simulation of the spike propagation to points 1–8. The propagation time was counted from the moment of the spike initiation in the primary axon (point 0). Dashed lines correspond to potentials of 0 mV and −70 mV.
Figure 2
Figure 2. Comparison of passive membrane properties of ALT-PNs and SG neurons
RIN and τ0 were measured from membrane responses evoked in current-clamp by a 500 ms hyperpolarizing current pulse of −10 pA. The neurons were kept at −70 mV. τ0versus RIN was plotted for 40 anatomically confirmed ALT-PNs (red circles) and 122 SG neurons (blue circles) from Santos et al. (2009). Linear fit of the data points in each group is shown by oblique dashed lines. The mean RIN and τ0 are indicated by vertical and horizontal continuous lines, respectively. For SG neurons, RIN = 1.73 ± 0.06 GΩ and τ0 = 76.2 ± 3.4 ms (n = 122). The mean values for ALT-PNs are given in the text.
Figure 6
Figure 6. Latency and efficacy of monosynaptic inputs
A, a composite EPSC with three components showing latencies of 2, 3 and 6 ms (indicated by arrowheads). The analysis of the components was done in Fig. 3. In the current-clamp mode, simultaneous activation of all components (uppermost of 3 consecutive traces) increased the membrane depolarization which, however, remained subthreshold. B, EPSC evoked in the connection with the longest latency (5 consecutive traces). The histogram shows the distribution of the EPSC latencies measured in 47 episodes. Bin width, 0.25 ms. The mean latency was 12.4 ± 0.1 ms. For 42 measurements, the latency variation was within 1 ms (a grey bar), and for all 47 measurements within 2 ms. This long-latency input evoked spike firing in each of 6 consecutive stimulations. This connection also showed a shorter-latency monosynaptic component which, however, was not activated in the episodes analysed. In current-clamp, dotted lines indicate a preset potential of −70 mV (note different amplifications in A and B).

Similar articles

Cited by

References

    1. Antal M, Fukazawa Y, Eordogh M, Muszil D, Molnar E, Itakura M, Takahashi M, Shigemoto R. Numbers, densities, and colocalization of AMPA- and NMDA-type glutamate receptors at individual synapses in the superficial spinal dorsal horn of rats. J Neurosci. 2008;28:9692–9701. - PMC - PubMed
    1. Bice TN, Beal JA. Quantitative and neurogenic analysis of the total population and subpopulations of neurons defined by axon projection in the superficial dorsal horn of the rat lumbar spinal cord. J Comp Neurol. 1997;388:550–564. - PubMed
    1. Cajal RyS. Histologie du systeme nerveux de l'homme et des vertebres. Paris: A. Maloine; 1909.
    1. Drummond GB. Reporting ethical matters in The Journal of Physiology: standards and advice. J Physiol. 2009;587:713–719. - PMC - PubMed
    1. Graham BA, Brichta AM, Callister RJ. Moving from an averaged to specific view of spinal cord pain processing circuits. J Neurophysiol. 2007;98:1057–1063. - PubMed

Publication types