Comparative Study
. 2010 Nov 15;588(Pt 22):4453-74.
doi: 10.1113/jphysiol.2010.196824. Epub 2010 Sep 27.

Ca2+ imaging of activity in ICC-MY during local mucosal reflexes and the colonic migrating motor complex in the murine large intestine

Affiliations
Comparative Study

Ca2+ imaging of activity in ICC-MY during local mucosal reflexes and the colonic migrating motor complex in the murine large intestine

Peter O Bayguinov et al. J Physiol. .

Abstract

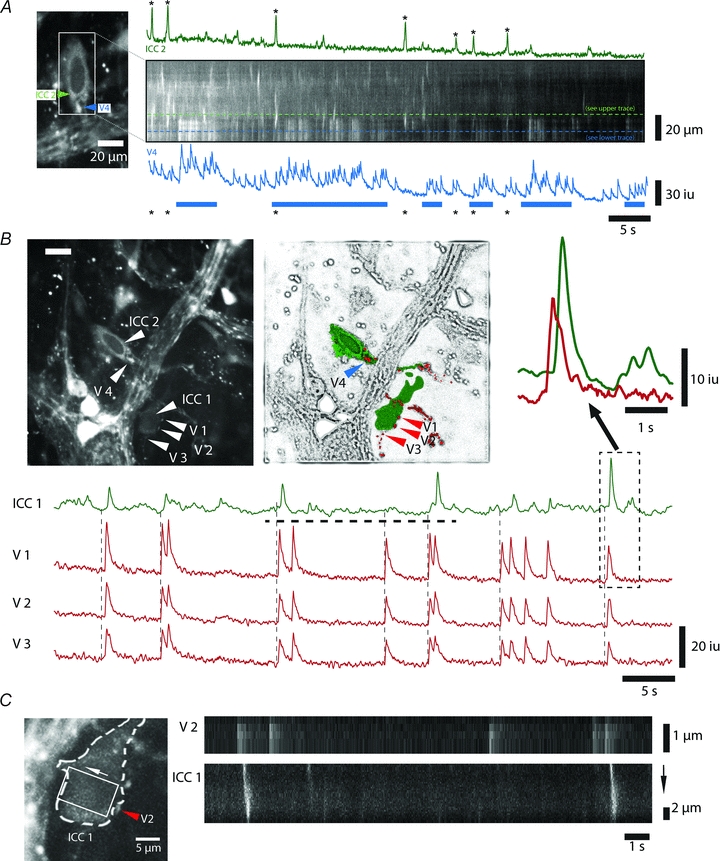
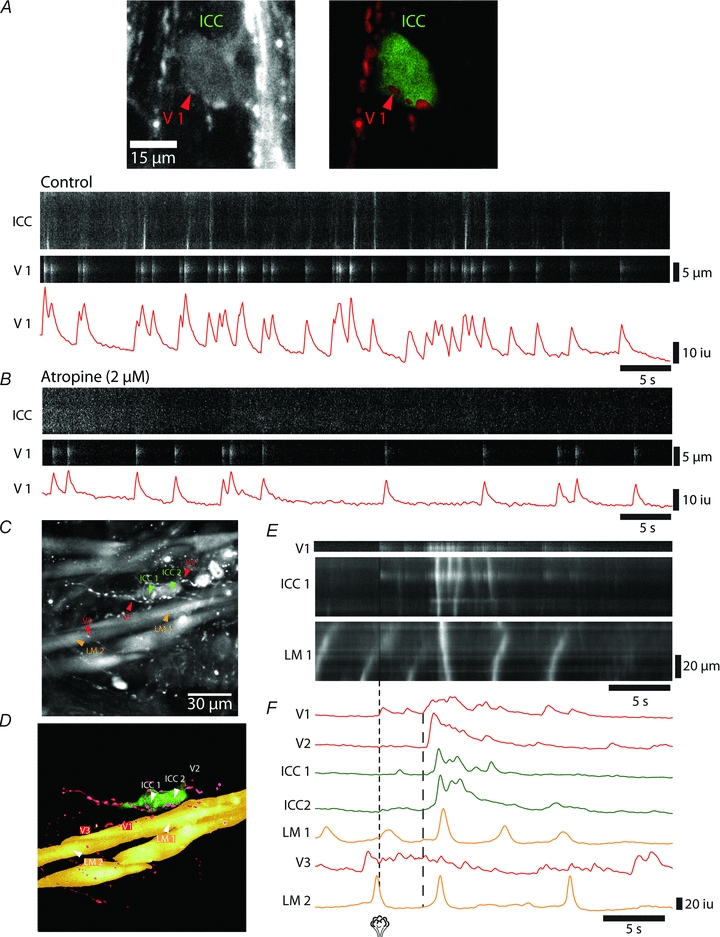
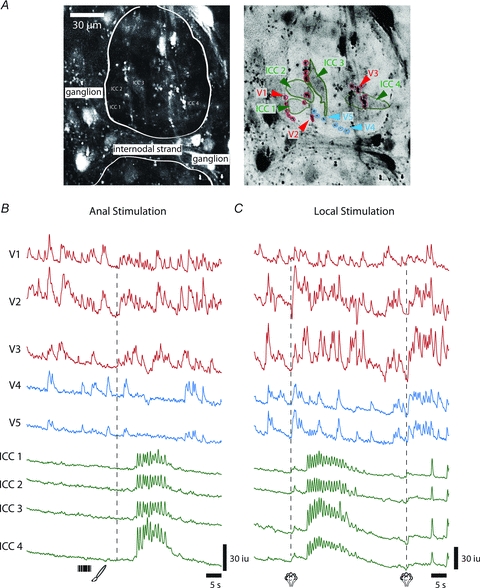
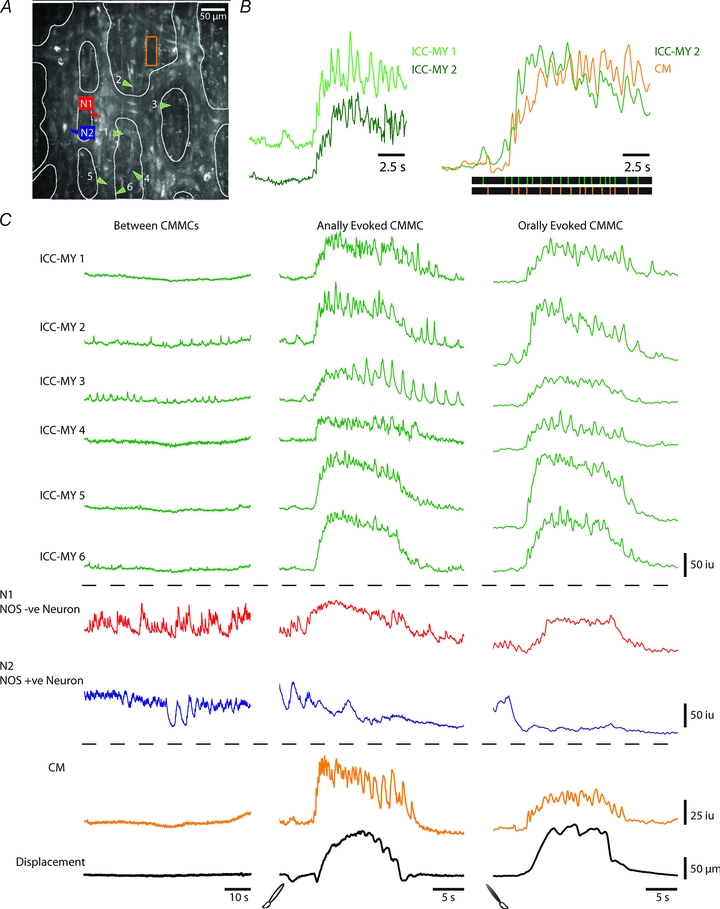
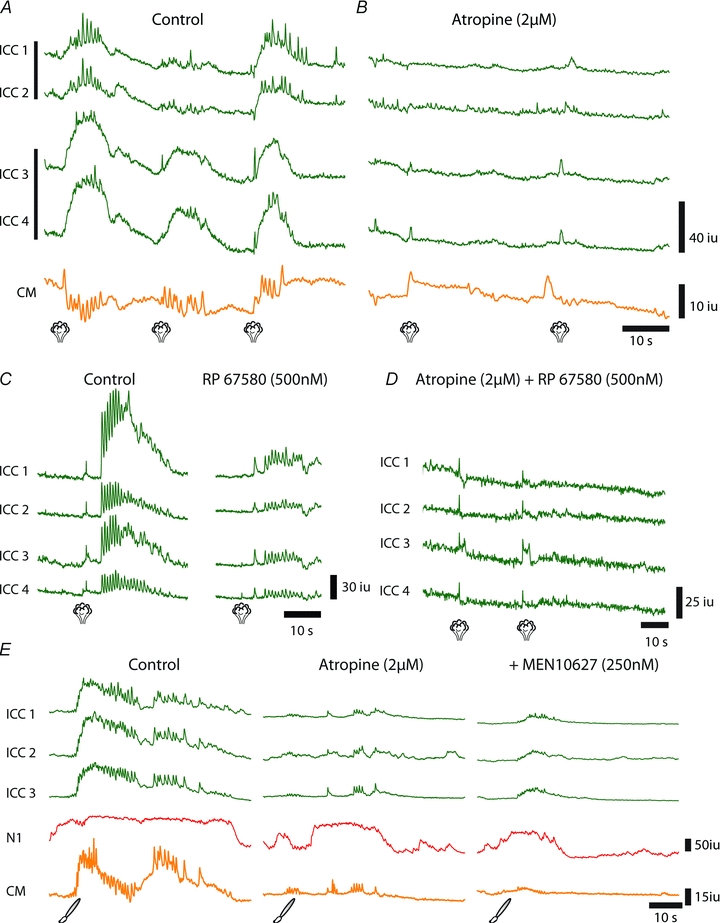
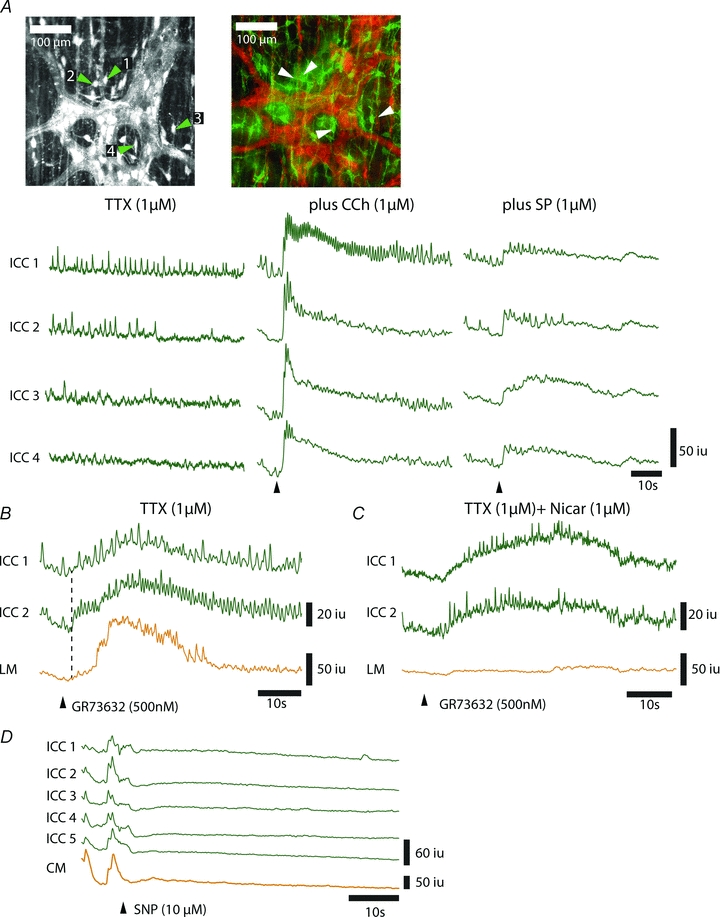
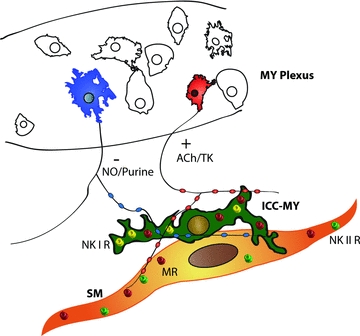
Colonic migrating motor complexes (CMMCs) are neurally mediated, cyclical contractile and electrical events, which typically propagate along the colon every 2-3 min in the mouse. We examined the interactions between myenteric neurons, interstitial cells of Cajal in the myenteric region (ICC-MY) and smooth muscle cells during CMMCs using Ca(2+) imaging. CMMCs occurred spontaneously or were evoked by stimulating the mucosa locally, or by brushing it at either end of the colon. Between CMMCs, most ICC-MY were often quiescent; their lack of activity was correlated with ongoing Ca(2+) transients in varicosities on the axons of presumably inhibitory motor neurons that were on or surrounded ICC-MY. Ca(2+) transients in other varicosities initiated intracellular Ca(2+) waves in adjacent ICC-MY, which were blocked by atropine, suggesting they were on the axons of excitatory motor neurons. Following TTX (1 μM), or blockade of inhibitory neurotransmission with N(ω)-nitro-L-arginine (L-NA, a NO synthesis inhibitor, 10 μM) and MRS 2500 (a P2Y(1) antagonist, 1 μM), ongoing spark/puff like activity and rhythmic intracellular Ca(2+) waves (38.1 ± 2.9 cycles min(-1)) were observed, yet this activity was uncoupled, even between ICC-MY in close apposition. During spontaneous or evoked CMMCs there was an increase in the frequency (62.9 ± 1.4 cycles min(-1)) and amplitude of Ca(2+) transients in ICC-MY and muscle, which often had synchronized activity. At the same time, activity in varicosites along excitatory and inhibitory motor nerve fibres increased and decreased respectively, leading to an overall excitation of ICC-MY. Atropine (1 μM) reduced the evoked responses in ICC-MY, and subsequent addition of an NK1 antagonist (RP 67580, 500 nM) completely blocked the responses to stimulation, as did applying these drugs in reverse order. An NKII antagonist (MEN 10,376, 500 nM) had no effect on the evoked responses in ICC-MY. Following TTX application, carbachol (1 μM), substance P (1 μM) and an NKI agonist (GR73632, 100 nM) produced the fast oscillations superimposed on a slow increase in Ca(2+) in ICC-MY, whereas SNP (an NO donor, 10 μM) abolished all activity in ICC-MY. In conclusion, ICC-MY, which are under tonic inhibition, are pacemakers whose activity can be synchronized by excitatory nerves to couple the longitudinal and circular muscles during the CMMC. ICC-MY receive excitatory input from motor neurons that release acetylcholine and tachykinins acting on muscarinic and NK1 receptors, respectively.


Figures

Figure 1
Figure 1. Examining the structural association between the myenteric plexus and ICC-MY
A, whole colonic preparations were made, where the organ was kept as a tube, save for the oral-most and anal-most 1 cm, where the tissues were opened along the mesenteric border and pinned mucosa-uppermost to allow for anal or oral brush stimulation (see symbols). A small diameter (1 mm) polyurethane tube was embedded into the Sylgard of the recording chamber to allow for local stimulation to be applied directly underneath the site of recording using brief N2 puffs (see symbol) from a picospritzer. B, whole colonic width panorama, demonstrating the close association of the myenteric plexus with ICC at the serosal and myenteric regions of the murine colon. Tissues were stained with ACK-2 (Alexa Fluor 488, green) and PGP 9.5 (Alexa Fluor 594, red). C and D, higher resolution magnification sections from B, as indicated, demonstrating the dense integration of ICC-MY with the myenteric plexus in both areas where the longitudinal muscle was left intact (C), and where it had been removed (D). E, 40× confocal maximal projection (left) from the myenteric region of the murine colon stained with PGP 9.5 (Alexa Fluor 594) and ACK-2 (Alexa Fluor 488). Right panel shows a thresholded and inverted binary image of the isolated green channel in the left panel, demonstrating the fusiform morphology of ICC-MY and their loose network at the myenteric plexus. F, immunohistochemical dual staining for ACK-2 (Alexa Fluor 594) and vAChT (Alexa Fluor 488). Note the varicose nerve fibres present in the primary plexus (a), as well as in the interganglionic space (b), spanning over and in close apposition to ICC-MY.
Figure 2
Figure 2. Activity of ICC-MY between CMMCs
A, dynamic Ca2+ imaging data (left grey panel, mean stack projection from 2000 frames) showing ICC-MY (left green panel), in close association with the myenteric plexus (red panel). Ca2+ activity in these ICCs in control conditions (see traces ICC1–4), a myenteric neuron (N1 red trace) in an adjacent ganglion, and with tissue displacement are shown in the traces. Thresholded AND/OR sum image of PGP9.5 and ACK-2 staining, shown at top right. White areas represent the location of ganglia, green is c-kit positive cells in interganglionic spaces, and purple is c-kit positive cells spanning over the ganglia. B, lower-magnification (20×) imaging of a groups of neurons (N1–3), before (left panel) and after (right panel) the addition of TTX (1 μm) and hexamethonium (100 μm). Corresponding activity in ICC-MY in both conditions is illustrated in green (ICC 1–5).
Figure 3
Figure 3. Effect of blocking inhibitory neurotransmission
In control conditions ICC-MY 1–5 exhibited little spontaneous activity. Following the purinergic P2Y1 receptor antagonist MRS 2500 (1 μm) spontaneous Ca2+ transients in these ICC-MY increased. The further addition of l-NA (10 μm; a nitric oxide synthesis inhibitor) revealed intracellular Ca2+ waves in the majority of ICC-MY.
Figure 4
Figure 4. Are ICC-MY coupled?
A, Intracellular Ca2+ activity in three closely apposed ICC-MY (1–3) represented as spatiotemporal maps. Bright vertical bands represent intracellular Ca2+ waves in the individual ICCs. Pseudocolored ST maps correspond to colored regions of interest in left hand panel, and are overlaid below to show the lack of temporal correlation of the Ca2+ transients in the ICCs. B, spark/puff like (duration ∼200 ms) activity in ICC-MY. Z-stack mean projection (left), demonstrating the cell morphology. Pseudocoloured sequence shows Ca2+ recordings in 64 ms intervals. Note the formation of 2 independent events (* and #). C, spontaneous activity in two groups of ICC-MY, each group located in different interganglionic areas (left panel, maximum Ca2+ projection, colour indicates the trace on right). Aligned insets showing expanded traces (see black bars on large traces), calibration bars = 1 s. This activity was recorded in nicardipine (1 μm), which blocks Ca2+ transients in the muscle. D, Ca2+ transient activity in an ICC-MY (ICC-1, green trace) and adjacent circular muscle (CM, orange trace) following anal mucosal brush stimulation. Inset on right shows the superimposed traces in the box. Image below shows the location of the ICC-MY and the CM cell from which recordings were made.
Figure 5
Figure 5. Activity of excitatory and inhibitory varicosities on ICC-MY
A, activity of an inhibitory varicosity onto an ICC-MY. Ca2+ activity in a varicosity (V4 in inset on left and in B) represented as a trace (blue trace below) and in the ST map (see blue line on map), and intracellular waves in the adjacent ICC (ICC2, see inset and B) shown as a trace (green upper trace) and ST map. B, left panel: mean projection of Ca2+ activity showing two ICC-MY (ICC1 and 2) and the adjacent varicosities (V1–3). Right panel: high-pass coloured cartoon illustrating the location of the ICC-MY (green) and the varicosities (red) from the left pannel. Ca2+ transient traces of excitatory varicosities (V1–3; red) and the adjacent ICC (ICC1; green). Vertical dotted lines represent onset of Ca2+ transients in varicosities. Inset shows single peaks in ICC1 and V1, inside the dotted box. C, zoomed-in inset of ICC1 and V2 in B (left panel). ST maps showing the activity in V1 and intracellular Ca2+ waves in ICC1 during two events (see dotted horizontal line underneath ICC1 trace in B). ST map for ICC1 was constructed inside the region of interest identified in the inset, and arrows identify the direction of wave propagation.
Figure 6
Figure 6. Activation of ICC-MY by excitatory varicosities
A, image shows ICC-MY with closely associated varicosities (red). Spatio-temporal maps showing the activity in an ICC (top map) and an adjacent varicosity (see B below). Ca2+ transient trace of the same varicosity. B, activity in the same ICC (upper map) and varicosity (lower map and trace) from A following the application of atropine (2 μm). C, Ca2+ maximal projection showing varicosities, ICC-MY, and longitudinal muscle cells at the myenteric border. D, cartoon representation of C, outlining the varicosities (red), ICC (green), and muscle cells (orange). E, spatio-temporal maps showing the activity of a varicosity (V1 in D and E), and the intracellular wave in an ICC (ICC1) and a longitudinal muscle cell (LM1). Local stimulus is in line with G below. F, Ca2+ transient activity in ICC-MY (green), varicosities (red) and longtudinal muscle cells (orange) as outlined in C and D. Vertical dotted lines indicate the local stimulation puff and the onset of activity in varicosities 1 and 2 (V1 and 2).
Figure 7
Figure 7. Responses in varicosities during the CMMC
A, left, maximum Ca2+ projection showing the location of ICC-MY in the interganglionic space. White outline indicates the edges of the myenteric ganglia and the internodal strands. Right, inverted and colour outlined version of the left panel indicating the ICC-MY (ICC1–4) and varicosities (V1–5), whose activity is shown in B and C. B, Ca2+ activity in ICC-MY and adjacent varicosities during an anally evoked CMMC. Varicosities whose Ca2+ transient frequency increased during the CMMC are depicted in red (V1–3), while those whose activity decreased are shown in blue (V4–5). C, Ca2+ activity in the same ICC-MY and varicosities, in response to a local N2 puff stimulation. Note the activity in V4–5 following the first puff and following the second puff, and the resultant activity in the ICCs.
Figure 8
Figure 8. Convergence of neuronal pathways onto ICC-MY
A, average Ca2+ projection indicating the location of individual cells represented in B and C. White outline indicates the borders of the ganglia in the field of view. B, left, expanded traces of ICC-MY 1 and ICC-MY 2 at the onset of an anally evoked CMMC showing the fast oscillatory activity (see middle panel in C). Right, expanded traces of ICC-MY 1 and the circular muscle at the initiation of an orally evoked CMMC. Colour coordinated bars below traces indicate peaks of traces above. C, activity of ICC-MY (green, ICC-MY 1–6), NOS −ve neurons (red, N1), NOS +ve neuron (blue, N2), the circular muscle (orange, CM) and the tissue displacement between CMMCs (left), and during an anally (middle) and orally evoked (right) CMMC using mucosal brush stimulation (see symbols).
Figure 9
Figure 9. Effect of antagonists on responses in ICC-MY
A, activity of ICC-MY (green Ca2+ transient traces) and circular muscle (orange trace) in control conditions in response to local stimulation. Vertical bars on left of ICC1–2 and 3–4 traces indicate that these pairs of cells lay in close apposition to one another. B, activity in the same ICC-MY and muscle cells as in A following the application of atropine (2 μm) and in response to local stimulation. Scale bars are the same for A and B. C, activation of ICC-MY in response to a local stimulation before (left traces) and following (right traces) the application of RP 67580 (500 nm; NK I antagonist). Scale bars are the same for both sets of traces. D, responses in ICC-MY in response to local stimulation following the application of both atropine (2 μm) and RP 67580 (500 nm). E, Ca2+ transient activity in ICC-MY (green traces, ICC1–3), a myenteric neuron (red trace, N1), and the circular muscle (orange trace, CM) in response to an anal mucosal brush stimulation, in control (left), and following the sequestial addition of atropine (2 μm), and MEN 10627 (250 nm; NK II angtagonist).
Figure 10
Figure 10. Effect of excitatory neurotransmitter receptor agonists on ICC-MY
A, maximal Ca2+ projection (left panel) and immunohistochemical labelling with PGP 9.5 (red) and ACK-2 (green) (right panel) of the same area. Traces below show the activity of the identified ICC-MY in the presence of TTX (1 μm), and following spritzing (black arrow) of carbachol (1 μm, CCh, middle traces), and substance P (1 μm, SP, right traces). B, responses of ICC-MY (ICC 1–2) and longitudinal muscle (LM) cells in TTX (1 μm) following spritzing of GR73632 (500 nm, NK I agonist). C, same as B, but in the presence of nicardipine (1 μm, L-type Ca2+ channel blocker), which blocked the response in the muscle. D, sodium nitroprusside (SNP; 10 μm) spritzed onto the preparation suppressed activity in ICC-MY (ICC 1–5) and a CM cell.
Figure 11
Figure 11. Schematic representation of the innervation of ICC-MY and colonic smooth muscle
Blue and red neurons indicate inhibitory (release purines and NO) and excitatory motor neurons (release ACh and TKs) within the myenteric plexus (MR, muscarinic receptor; NK I R, NK I receptor; NK II R, NK II receptor) that innervate both ICC-MY and smooth muscle cells.

Similar articles

Cited by

References

    1. Aranishi H, Kunisawa Y, Komuro T. Characterization of interstitial cells of Cajal in the subserosal layer of the guinea-pig colon. Cell Tissue Res. 2009;335:323–329. - PubMed
    1. Bayguinov PO, Hennig GW, Smith TK. Calcium activity in different classes of myenteric neurons underlying the migrating motor complex in the murine colon. J Physiol. 2010a;588:399–421. - PMC - PubMed
    1. Bayguinov PO, Hennig GW, Smith TK. Generation of complex neuronal behavior in a mammalian nervous system. Physiological News. 2010b in press.
    1. Beckett EA, Horiguchi K, Khoyi M, Sanders KM, Ward SM. Loss of enteric motor neurotransmission in the gastric fundus of Sl/Sl(d) mice. J Physiol. 2002;543:871–887. - PMC - PubMed
    1. Beckett EA, Takeda Y, Yanase H, Sanders KM, Ward SM. Synaptic specializations exist between enteric motor nerves and interstitial cells of Cajal in the murine stomach. J Comp Neurol. 2005;493:193–206. - PubMed

Publication types

MeSH terms

LinkOut - more resources