Comparative Study
. 2011 Jan;336(1):145-54.
doi: 10.1124/jpet.110.171645. Epub 2010 Sep 27.

Loss of ethanol conditioned taste aversion and motor stimulation in knockin mice with ethanol-insensitive α2-containing GABA(A) receptors

Affiliations
Comparative Study

Loss of ethanol conditioned taste aversion and motor stimulation in knockin mice with ethanol-insensitive α2-containing GABA(A) receptors

Y A Blednov et al. J Pharmacol Exp Ther. 2011 Jan.

Abstract

GABA type A receptors (GABA(A)-Rs) are potential targets of ethanol. However, there are multiple subtypes of this receptor, and, thus far, individual subunits have not been definitively linked with specific ethanol behavioral actions. Interestingly, though, a chromosomal cluster of four GABA(A)-R subunit genes, including α2 (Gabra2), was associated with human alcoholism (Am J Hum Genet 74:705-714, 2004; Pharmacol Biochem Behav 90:95-104, 2008; J Psychiatr Res 42:184-191, 2008). The goal of our study was to determine the role of receptors containing this subunit in alcohol action. We designed an α2 subunit with serine 270 to histidine and leucine 277 to alanine mutations that was insensitive to potentiation by ethanol yet retained normal GABA sensitivity in a recombinant expression system. Knockin mice containing this mutant subunit were tested in a range of ethanol behavioral tests. These mutant mice did not develop the typical conditioned taste aversion in response to ethanol and showed complete loss of the motor stimulant effects of ethanol. Conversely, they also demonstrated changes in ethanol intake and preference in multiple tests. The knockin mice showed increased ethanol-induced hypnosis but no difference in anxiolytic effects or recovery from acute ethanol-induced motor incoordination. Overall, these studies demonstrate that the effects of ethanol at GABAergic synapses containing the α2 subunit are important for specific behavioral effects of ethanol that may be relevant to the genetic linkage of this subunit with human alcoholism.


Figures
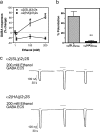
Fig. 1.
Fig. 1.
Ethanol modulation of GABA responses in wild-type (SL) and mutant (HA) α2β3γ2s GABAA receptors expressed in Xenopus oocytes. a, GABA responses in α2β3γ2s GABAA receptors. Pooled data are represented as mean ± S.E.M. (n = 7–8). Effects of ethanol were tested with EC5–10 GABA. *, p < 0.01, significant differences from wild type for the same concentration of ethanol (two-way ANOVA followed by Bonferroni post test). b, GABA responses in α2β2γ2s GABAA receptors. Pooled data are represented as mean ± S.E.M. (n = 4 each). **, p < 0.01, Student's t test; difference between responses in wild-type and mutant GABA receptors. c, the actual tracing from oocyte recording with α2β2γ2s GABAA receptors.
Fig. 2.
Fig. 2.
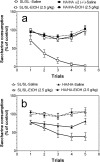
α2 Knockin mice develop weaker conditioned taste aversion for ethanol. a, male mice (n = 5 for saline injection for both genotypes; n = 5–6 for groups with ethanol injection). b, female mice (n = 5 for saline injection for both genotypes; n = 9–10 for groups with ethanol injection). No differences between saline-treated groups of wild-type and mutant mice of corresponding sex were found (two-way ANOVA). Wild-type mice of both sexes developed significantly stronger CTA than knockin mice of both sexes (comparison of ethanol-treated groups of wild-type and mutant mice of corresponding sex) (males: p < 0.001; females: p < 0.001; two-way ANOVA). Values represent mean ± S.E.M.
Fig. 3.
Fig. 3.
Ethanol intake in a limited access (one-bottle DID) model. a, male mice (n = 8–11 per genotype). The amount of ethanol consumed (g/kg) with 2- or 4-h access periods is shown. No differences between wild-type and mutant male mice were found (two-way ANOVA). b, female mice (n = 7–9 per genotype). Female mutant mice consumed larger amounts of ethanol during first 3 days with 2-h access (p < 0.01; two-way ANOVA). c, male mice (n = 8–11 per genotype). Male mutant mice consumed larger amounts of ethanol during 9 days with 2-h access (p < 0.01; two-way ANOVA). d, female mice (n = 7–9 per genotype). Female mutant mice consumed larger amounts of ethanol during 9 days with 2-h access (p < 0.001; two-way ANOVA). Values represent mean ± S.E.M.
Fig. 4.
Fig. 4.
Ethanol intake in limited access (two-bottle DID) model. a–c, male mice. a, amount of ethanol consumed given as g/kg/3 h. b, preference for ethanol as a percentage of fluid intake. c, total fluid intake (alcohol solution + water) given as g/kg/3 h. Male mutant mice consumed slightly larger amounts of ethanol (p < 0.05; two-way ANOVA) and showed slightly higher preference for ethanol (p < 0.05; two-way ANOVA) than wild-type littermates. No differences between genotypes for male mice in the amount of consumed fluid were found (two-way ANOVA) (n = 7–9 per genotype). d–f, female mice. d, amount of ethanol consumed given as g/kg/3 h. e, preference for ethanol as a percentage of fluid intake. f, total fluid intake given as g/kg/3 h. Female mutant mice consumed larger amounts of ethanol (p < 0.01; two-way ANOVA) and larger amounts of fluid (p < 0.001; two-way ANOVA) than wild-type littermates. No differences were observed between genotypes for female mice in preference for ethanol (two-way ANOVA) (n = 6–8 per genotype). Values represent mean ± S.E.M.
Fig. 5.
Fig. 5.
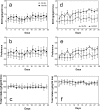
Ethanol intake in a two-bottle choice test with intermittent access to ethanol (every other day drinking). a–c, male mice. a, amount of ethanol consumed given as g/kg/24 h. b, preference for ethanol as a percentage of fluid intake. c, total fluid intake given as g/kg/24 h. Mutant male mice consumed ethanol with a slightly higher preference than wild-type male mice (p < 0.05; two-way ANOVA). No significant differences in amount of ethanol consumed and total amount of fluid consumed were found (two-way ANOVA) (n = 7 per genotype). d–f, female mice. d, amount of ethanol consumed given as g/kg/24 h. e, preference for ethanol as a percentage of fluid intake. f, total fluid intake given as g/kg/24 h. Mutant female mice consumed larger amounts of ethanol (p < 0.001; two-way ANOVA) with higher preference for ethanol (p < 0.001; two-way ANOVA) than their wild-type littermates. Total fluid intake was also slightly elevated in mutant female mice (p < 0.05; two-way ANOVA) (n = 7 per genotype). Values represent mean ± S.E.M.
Fig. 6.
Fig. 6.
Ethanol intake in a two-bottle choice test with 24-h continuous access to ethanol. a–c, male mice. a, amount of ethanol consumed given as g/kg/24 h. b, preference for ethanol as a percentage of fluid intake. c, total fluid intake given as g/kg/24 h. Mutant male mice consumed smaller amounts of ethanol (p < 0.001; two-way ANOVA) with reduced preference for ethanol (p < 0.001; two-way ANOVA) than their wild-type littermates. Total fluid intake was elevated in mutant male mice (p < 0.001; two-way ANOVA) (n = 10 per genotype). d–f, female mice. d, amount of ethanol consumed given as g/kg/24 h. e, preference for ethanol as a percentage of fluid intake. f, total fluid intake given as g/kg/24 h. No differences between mutant and wild-type female mice in ethanol intake, preference for ethanol, or total amount of fluid consumed were found (two-way ANOVA) (n = 9–10 per genotype). Values represent mean ± S.E.M.
Fig. 7.
Fig. 7.
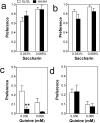
Saccharin and quinine intake in a two-bottle choice test with 24-h continuous access to tastants. a and c, male mice (n = 10 per genotype). a, preference for saccharin. c, preference for quinine. b and d, female mice (n = 10 per genotype). b, preference for saccharin. d, preference for quinine. No differences in preference for saccharin between mutant mice and wild-type mice of both sexes were found (two-way ANOVA). Only mutant male mice demonstrated stronger avoidance for the bitter quinine solution (p < 0.001, main effect of genotype; two-way ANOVA). **, p < 0.01, significant differences relative to wild-type mice for the same dose of quinine (Bonferroni post hoc test). Values represent mean ± S.E.M.
Fig. 8.
Fig. 8.
Evaluation of anxiety and activity using the elevated plus maze. a, percentage of total time spent in open arms. There was a dependence only on treatment (p < 0.01; two-way ANOVA). b, percentage of open arm entries. There was a dependence on genotype (p < 0.05; two-way ANOVA) and treatment (p < 0.01; two-way ANOVA). c, total arm entries. There was a dependence on genotype (p < 0.01; two-way ANOVA) and treatment (p < 0.05; two-way ANOVA) (n = 9–11 per genotype). *, p < 0.05, significant differences relative to wild-type mice for the same concentration of ethanol (two-way ANOVA Fischer's post hoc test). #, p < 0.05, significant differences between ethanol-injected and control groups of wild-type mice (two-way ANOVA Fischer's post hoc test). Values represent mean ± S.E.M.
Fig. 9.
Fig. 9.
α2 Knockin mice are less sensitive to ethanol-induced motor stimulation in the open field. There was a dependence on genotype (p < 0.001; two-way ANOVA) and dose of ethanol (p < 0.01; two-way ANOVA). Within-groups analyses of variance showed strong effect of ethanol in wild-type mice (p < 0.001; one-way ANOVA) and no effect of ethanol in knockin mice. ###, P < 0.001, significant difference from saline control for the same genotype (one-way ANOVA, Fischer's post hoc test). ***, P < 0.001, significant difference from the same dose of ethanol between two different genotypes (two-way ANOVA, Fischer's post hoc test). Each point represents an independent group of animals (n = 15–16 per each group of each genotype).
Fig. 10.
Fig. 10.
Depressant effects of ethanol in α2 knockin mice. a, time on the rotarod in seconds before and after motor incoordination induced by ethanol (2 g/kg) (n = 6 per genotype). No differences between wild-type and mutant mice in recovery from ethanol-induced motor incoordination were found (two-way ANOVA). b, duration of LORR in minutes after injection of ethanol (3.25 g/kg) (n = 6 per genotype). ***, P < 0.05, significant difference between genotypes (Student's t test). Values represent mean ± S.E.M.

Similar articles

Cited by

References

    1. Blednov YA, Harris RA. (2008) Metabotropic glutamate receptor 5 (mGluR5) regulation of ethanol sedation, dependence and consumption: relationship to acamprosate actions. Int J Neuropsychopharmacol 11:775–793 - PMC - PubMed
    1. Blednov YA, Walker D, Alva H, Creech K, Findlay G, Harris RA. (2003) GABAA receptor α1 and β2 subunit null mutant mice: behavioral responses to ethanol. J Pharmacol Exp Ther 305:854–863 - PubMed
    1. Blednov YA, Walker D, Martinez M, Levine M, Damak S, Margolskee RF. (2008) Perception of sweet taste is important for voluntary alcohol consumption in mice. Genes Brain Behav 7:1–13 - PMC - PubMed
    1. Boehm SL, 2nd, Ponomarev I, Jennings AW, Whiting PJ, Rosahl TW, Garrett EM, Blednov YA, Harris RA. (2004) γ-Aminobutyric acid A receptor subunit mutant mice: new perspectives on alcohol actions. Biochem Pharmacol 68:1581–1602 - PubMed
    1. Borghese CM, Werner DF, Topf N, Baron NV, Henderson LA, Boehm SL, 2nd, Blednov YA, Saad A, Dai S, Pearce RA, et al. (2006) An isoflurane- and alcohol-insensitive mutant GABA(A) receptor α(1) subunit with near-normal apparent affinity for GABA: characterization in heterologous systems and production of knockin mice. J Pharmacol Exp Ther 319:208–218 - PubMed

Publication types

MeSH terms

LinkOut - more resources