

Transcriptomic and innate immune responses to Yersinia pestis in the lymph node during bubonic plague
- PMID: 20876291
- PMCID: PMC2981309
- DOI: 10.1128/IAI.00256-10
Transcriptomic and innate immune responses to Yersinia pestis in the lymph node during bubonic plague
Abstract
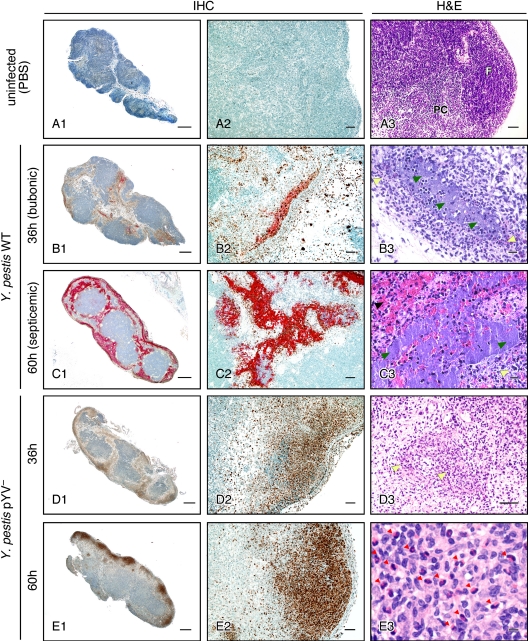
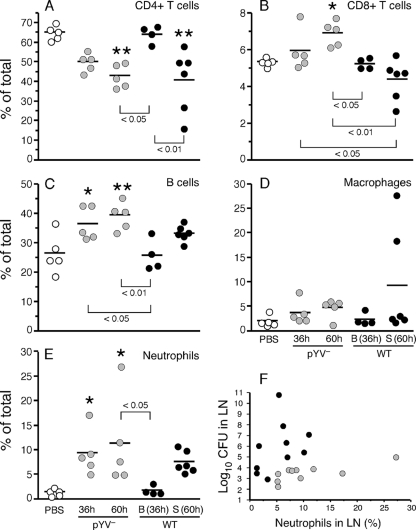
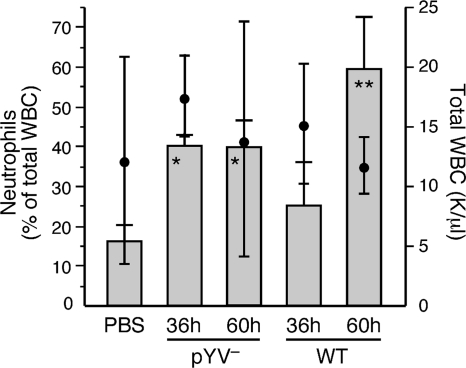
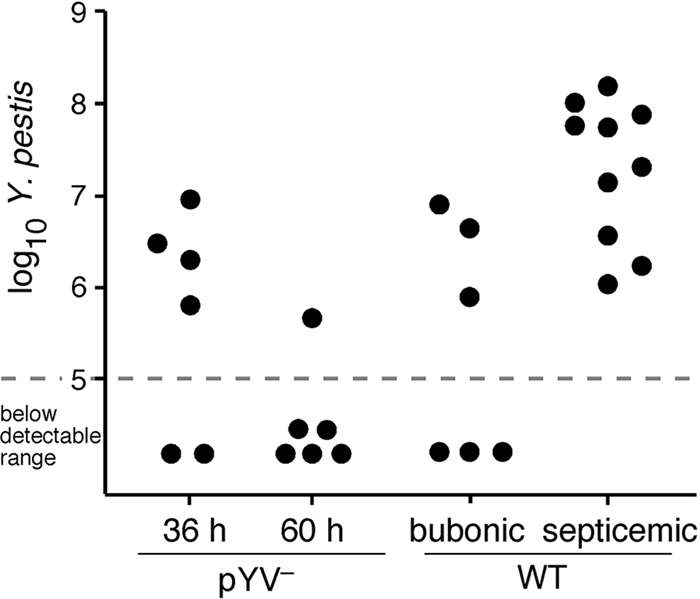
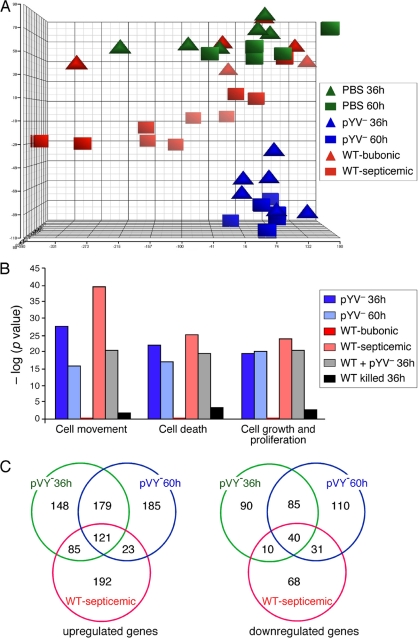
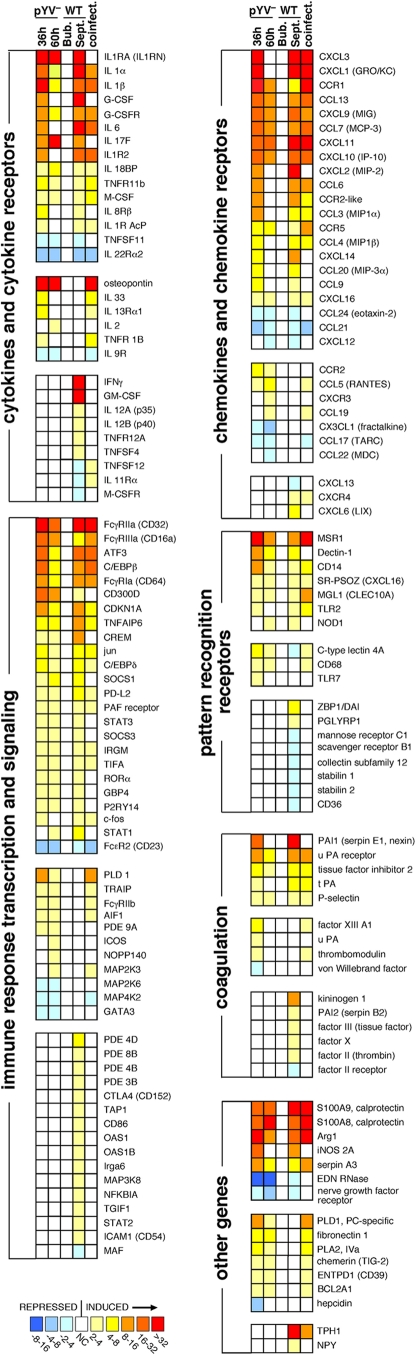
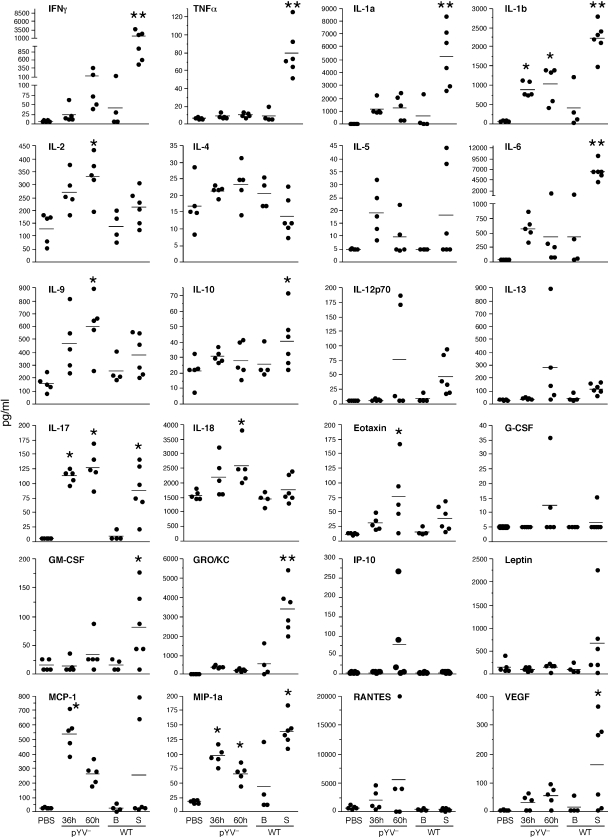
A delayed inflammatory response is a prominent feature of infection with Yersinia pestis, the agent of bubonic and pneumonic plague. Using a rat model of bubonic plague, we examined lymph node histopathology, transcriptome, and extracellular cytokine levels to broadly characterize the kinetics and extent of the host response to Y. pestis and how it is influenced by the Yersinia virulence plasmid (pYV). Remarkably, dissemination and multiplication of wild-type Y. pestis during the bubonic stage of disease did not induce any detectable gene expression or cytokine response by host lymph node cells in the developing bubo. Only after systemic spread had led to terminal septicemic plague was a transcriptomic response detected, which included upregulation of several cytokine, chemokine, and other immune response genes. Although an initial intracellular phase of Y. pestis infection has been postulated, a Th1-type cytokine response associated with classical activation of macrophages was not observed during the bubonic stage of disease. However, elevated levels of interleukin-17 (IL-17) were present in infected lymph nodes. In the absence of pYV, sustained recruitment to the lymph node of polymorphonuclear leukocytes (PMN, or neutrophils), the major IL-17 effector cells, correlated with clearance of infection. Thus, the ability to counteract a PMN response in the lymph node appears to be a major in vivo function of the Y. pestis virulence plasmid.
Figures
Similar articles
-
Yersinia pestis YopJ suppresses tumor necrosis factor alpha induction and contributes to apoptosis of immune cells in the lymph node but is not required for virulence in a rat model of bubonic plague.Infect Immun. 2006 Sep;74(9):5126-31. doi: 10.1128/IAI.00219-06. Infect Immun. 2006. PMID: 16926404 Free PMC article.
-
Role of the Yersinia pestis Ail protein in preventing a protective polymorphonuclear leukocyte response during bubonic plague.Infect Immun. 2011 Dec;79(12):4984-9. doi: 10.1128/IAI.05307-11. Epub 2011 Oct 3. Infect Immun. 2011. PMID: 21969002 Free PMC article.
-
A Deadly Path: Bacterial Spread During Bubonic Plague.Trends Microbiol. 2016 Apr;24(4):239-241. doi: 10.1016/j.tim.2016.01.010. Epub 2016 Feb 12. Trends Microbiol. 2016. PMID: 26875618 Free PMC article.
-
Yersinia pestis and pneumonic plague: Insight into how a lethal pathogen interfaces with innate immune populations in the lung to cause severe disease.Cell Immunol. 2024 Sep-Oct;403-404:104856. doi: 10.1016/j.cellimm.2024.104856. Epub 2024 Jul 10. Cell Immunol. 2024. PMID: 39002222 Review.
-
Yersinia pestis and the plague.Am J Clin Pathol. 2003 Jun;119 Suppl:S78-85. doi: 10.1309/DQM9-3R8Q-NQWB-FYU8. Am J Clin Pathol. 2003. PMID: 12951845 Review.
Cited by
-
Redundant and Cooperative Roles for Yersinia pestis Yop Effectors in the Inhibition of Human Neutrophil Exocytic Responses Revealed by Gain-of-Function Approach.Infect Immun. 2020 Feb 20;88(3):e00909-19. doi: 10.1128/IAI.00909-19. Print 2020 Feb 20. Infect Immun. 2020. PMID: 31871100 Free PMC article.
-
Plague gives surprises in the first decade of the 21st century in the United States and worldwide.Am J Trop Med Hyg. 2013 Oct;89(4):788-93. doi: 10.4269/ajtmh.13-0191. Epub 2013 Sep 16. Am J Trop Med Hyg. 2013. PMID: 24043686 Free PMC article. Review.
-
Yersinia pestis survival and replication within human neutrophil phagosomes and uptake of infected neutrophils by macrophages.J Leukoc Biol. 2014 Mar;95(3):389-98. doi: 10.1189/jlb.1112551. Epub 2013 Nov 13. J Leukoc Biol. 2014. PMID: 24227798 Free PMC article.
-
Role of Tellurite Resistance Operon in Filamentous Growth of Yersinia pestis in Macrophages.PLoS One. 2015 Nov 4;10(11):e0141984. doi: 10.1371/journal.pone.0141984. eCollection 2015. PLoS One. 2015. PMID: 26536670 Free PMC article.
-
The Genome of the Great Gerbil Reveals Species-Specific Duplication of an MHCII Gene.Genome Biol Evol. 2020 Feb 1;12(2):3832-3849. doi: 10.1093/gbe/evaa008. Genome Biol Evol. 2020. PMID: 31971556 Free PMC article.
References
-
- Alegre, M.-L., K. A. Frauwirth, and C. B. Thompson. 2001. T-cell regulation by CD28 and CTLA-4. Nat. Rev. Immunol. 1:220-228. - PubMed
-
- Bearden, S. W., and R. D. Perry. 1999. The Yfe system of Yersinia pestis transports iron and manganese and is required for full virulence of plague. Mol. Microbiol. 32:403-414. - PubMed
Publication types
MeSH terms
Substances
Grants and funding
LinkOut - more resources
Full Text Sources
Medical
Molecular Biology Databases
