. 2010 Oct 25;207(11):2369-81.
doi: 10.1084/jem.20100282. Epub 2010 Sep 27.

Age-dependent susceptibility to a viral disease due to decreased natural killer cell numbers and trafficking

Affiliations

Age-dependent susceptibility to a viral disease due to decreased natural killer cell numbers and trafficking

Min Fang et al. J Exp Med. .

Abstract

Although it is well known that aged hosts are generally more susceptible to viral diseases than the young, specific dysfunctions of the immune system directly responsible for this increased susceptibility have yet to be identified. We show that mice genetically resistant to mousepox (the mouse parallel of human smallpox) lose resistance at mid-age. Surprisingly, this loss of resistance is not a result of intrinsically defective T cell responses. Instead, the primary reason for the loss of resistance results from a decreased number of total and mature natural killer (NK) cells in the blood and an intrinsic impairment in their ability to migrate to the lymph node draining the site of infection, which is essential to curb systemic virus spread. Hence, our work links the age-dependent increase in susceptibility to a viral disease to a specific defect of NK cells, opening the possibility of exploring treatments to improve NK cell function in the aged with the goal of enhancing their resistance to viral diseases.


Figures

Figure 1.
Figure 1.
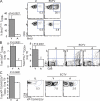
B6 mice gradually lose their natural resistance to mousepox as they age. (A) B6 mice of the indicated ages were infected with WT ECTV in the footpad and survival was determined. 2–3 mo (n = 50) versus 6–9 mo (n = 44), P = 0.0205; 2–3 mo versus 10–14 mo (n = 19), P = 0.0001; 2–3 mo versus 14–18 mo (n = 47), P < 0.0001. Animals of both sexes were used. (B) Young (Y) and aged (A) B6 mice were infected with WT ECTV, euthanized 7 dpi, and the number of live cells/spleen was determined by trypan blue exclusion. Results for uninfected controls (U) are shown for comparison. Data correspond to the mean ± SD of pooled organs of two to three mice per group from three individual experiments. (C) Young and aged B6 mice were infected with WT ECTV and euthanized 7 dpi, and virus titers in spleens and livers were determined by plaque assay. Data correspond to the mean ± SD of pooled organs of two to three mice per group from three individual experiments.
Figure 2.
Figure 2.
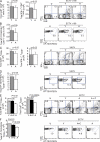
Severely reduced T cell response to WT ECTV in aged mice. (A) Young (Y) and aged (A) B6 mice were infected with 3,000 PFU WT ECTV. 5 dpi they were inoculated i.p. with 2 mg BrdU and euthanized 3 h later. D-LNs were collected, made into single cell suspensions, and stained for surface CD3 and CD8 and for intracellular BrdU. Column graphs indicate the percentage of TCD8+ cells in the D-LN that incorporated BrdU. Representative flow cytometry plots are shown together with those from uninfected controls (U) for comparison. Data are representative of three independent experiments. (B) Young and aged B6 mice were infected with 3,000 PFU WT ECTV and euthanized 7 dpi. Splenocytes were counted and restimulated with infected cells for 6 h with the addition of brefeldin A during the last hour. Next, the cells were stained for surface CD3 and CD8 and for intracellular IFN-γ and GzB, followed by flow cytometry. Column graphs indicate the calculated absolute number of TCD8+ cells in the spleen that expressed GzB (left) or IFN-γ (right). Representative flow cytometry plots are shown together with a plot corresponding to an uninfected control mouse for comparison. (C) As in B but showing the calculated absolute numbers and representative plots of CD8+Kb- TSYKFESV+ cells in the spleen. Data correspond to the mean ± SD of pooled organs of two to three mice per group from five individual experiments.
Figure 3.
Figure 3.
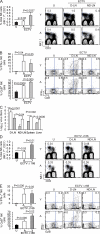
Aged mice mount normal TCD8+ cell responses to nonvirulent OPVs or WT ECTV when its replication is curtailed. (A) Young (Y) and aged (A) B6 mice were infected with 3,000 PFU ECTV Δ166 and euthanized 7 dpi. Splenocytes were counted, restimulated with infected cells for 6 h with the addition of brefeldin A during the last hour, and stained for surface CD3 and CD8 and for intracellular IFN-γ and GzB, followed by flow cytometry. Column graphs indicate the mean ± SD for the calculated absolute number of TCD8+ cells in the spleen that expressed GzB (left) or IFN-γ (right). Representative flow cytometry plots are shown together with a plot corresponding to an uninfected control (U) mouse for comparison. (B) As in A but showing the mean ± SD of the calculated absolute numbers and representative plots of CD8+Kb-TSYKFESV+ cells in the spleen. Data correspond to the mean ± SD of six individual mice from two independent experiments. (C) As in A but infected with 106 PFU VACV i.p. (D) As in B but infected with VACV i.p. Data correspond to the mean ± SD of six individual mice from three experiments. (E) As in A but infected with WT ECTV and, when indicated, aged mice were treated 2 dpi with 600 µg cidofovir (A+C) i.p. (F) Splenocytes from mice treated as in E were analyzed as in B. Data correspond to the mean ± SD of six individual mice from two experiments.
Figure 4.
Figure 4.
The defective TCD8+ cell response of aged mice to ECTV is not T cell intrinsic. (A) Experimental design for the adoptive transfer of CFSE-labeled lymphocytes from young (B6-Thy1.1) and aged (B6-CD45.1) donor mice into young B6 (B6 CD45.2-Thy1.2) hosts followed by ECTV infection and flow cytometry analysis gating on CD8+ cells. (B) B6 mice, as in A, were euthanized on the indicated dpi. Cells from the D-LN and spleen were restimulated ex vivo for 5 h with infected cells in the presence of brefeldin A and stained for surface CD3, CD8, Thy1.1, and CD45.1 and for intracellular IFN-γ and GzB, followed by flow cytometry. Top graphs show the data for the D-LN and lower graphs for the spleen. Columns show the percentage of TCD8+Y (gray bars) or TCD8+A (white bars) cells that produced IFN-γ (left) or that proliferated as indicated by CFSE dilution (right). Data correspond to the mean ± SD of pooled organs of three mice per group from three individual experiments. (C) Representative plots from B corresponding to spleens of individual mice 7 dpi. Plots corresponding to an uninfected control mouse are also shown for comparison. Plots were gated on CD8+ cells. (D) Aged B6 mice were adoptively transferred with lymphocytes from young B6-CD45.1 and infected with ECTV in the footpad. 7 dpi, the host (TCD8+A) and donor (TCD8+Y) TCD8+ cell responses were determined in spleens. Representative plots are shown. Data correspond to the mean ± SD of pooled organs of three mice per group from three individual experiments.
Figure 5.
Figure 5.
Deficient NK cell response to WT and attenuated ECTV in aged mice. (A) Young (Y) and aged (A) mice were infected with 3,000 PFU WT ECTV or left uninfected (U) and euthanized 2 dpi. D-LNs were made into single cell suspensions, incubated with brefeldin A for 1–2 h, and stained for surface NK1.1 and CD3 and for intracellular IFN-γ and GzB. Column graph indicates mean ± SD for the proportion of NK cells identified as NK1.1+ and CD3. Representative flow cytometry plots are also shown. (B) The samples in A were gated on NK cells and analyzed for expression of IFN-γ and GzB. Data correspond to the means ± SD for the proportion of NK cells expressing IFN-γ or GzB. Representative flow cytometry plots are also shown. Data are representative of at least five independent experiments. (C) Young and aged mice were infected with 3,000 PFU WT ECTV and euthanized 3 dpi. Virus titers in the indicated organs were determined by plaque assay. Gray bars, young mice; white bars, aged mice. Data correspond to the mean ± SD of six individual mice from two individual experiments. (D) As in A, but the mice were infected with ECTV Δ166. (E) As in B, except for the mice infected with ECTV Δ166 as in D. Data are representative of five independent experiments.
Figure 6.
Figure 6.
Mature NK cells fail to accumulate in the D-LN of aged mice. (A) Young and aged mice were infected with 3,000 PFU WT ECTV and euthanized 2 dpi. D-LN and ND-LN were made into single cell suspension and surface stained for CD3, NK1.1, CD11b, and CD27. Column graphs show the means ± SD for the proportion of cells within the NK1.1+CD3 population (NK cells) that were CD11b+ and CD27 (mature R3 cells). Gray columns, young mice; white columns, aged mice. Representative flow cytometry plots are shown with those from uninfected control mice for comparison. (B) As in A, but the mice were infected with ECTV Δ166. Data correspond to three experiments with three mice/group.
Figure 7.
Figure 7.
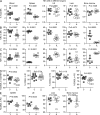
Alterations in number and phenotype of NK cells in various organs of aged mice. (A) Cells from the indicated organs from young and aged naive mice were stained for surface CD3, NK1.1, CD27, CD11b, and CD62L and analyzed by flow cytometry. For blood, mononuclear cells were isolated by ficoll-hypaque centrifugation. For the liver, mononuclear cells were isolated by centrifugation in a Percoll gradient. Data are representative of two to four similar experiments. P-values are for two-tailed Student’s t tests. (B) As in A, but displaying the proportion of R3 cells. (C) As in A, but displaying the proportion of R1 cells in the total NK cell population. (D) As in A, but displaying the proportion of the indicated NK population in the blood that was CD62L+. (E) As in A, but displaying the proportion of R3 NK cells in the indicated organs that was CD62L+. P-values are for two-tailed Student’s t tests. For all panels, the horizontal bars indicate the mean and the vertical bars the SEM.
Figure 8.
Figure 8.
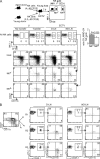
The mature R3 NK cells from aged mice are intrinsically defective in their ability to home to the D-LN. (A) Purified NKA and NKY cells were labeled with 4 µM and 0.2 µM CFSE (to allow detection of both populations in the same mouse) and cotransferred in equal numbers into young B6 mice. 1 d later, the mice were infected with ECTV and the NK cell responses determined on 2 dpi as indicated at the top of the figure. The top shows representative flow cytometry data gated on the NK1.1+CD3 NK. The bar graph on the right shows mean ± SD for the ratio in D-LN versus ND-LN for NKY and NKA cells. Top middle panels are gated on CFSE host NK cells. Bottom middle panels are gated on transferred NKY cells. Bottom panels are gated on transferred NKA cells. Data are representative of three similar experiments. (B) R1-R3 NKY cells from B6-CD45.1 mice were sorted with a flow cytometer (left) and adoptively transferred into young B6 (CD45.2) mice. The next day, the mice were infected with 3,000 PFU ECTV and the migration of the transferred cells to D-LN and ND-LN was determined 2 dpi. The left plot shows the NKY cells before sorting. For each type of LN, the plots on the left were gated on NK1.1+CD3 NK cells and the box shows the transferred cells. For each type of LN, the plots on the right are gated on the transferred cells. For each type of LN, the top, middle, and bottom panels are for mice transferred with R1, R2, and R3 cells, respectively. Note the relative increase of R3 cells in the D-LN as compared with the ND-LN. Data are representative of three similar experiments.
Figure 9.
Figure 9.
The NK cells from young mice preferentially migrate to the D-LN to reduce virus spread and protect aged mice from mousepox. (A) NKY and NKA from B6-CD45.1 mice were transferred into aged or young B6 (CD45.2) mice. The next day, the mice were infected with 3,000 PFU ECTV and the transferred NK cells were determined 2 dpi in the LNs. Data are representative of three experiments. (B) Ratio of NKY and NKA cells that migrate to the D-LN versus the ND-LN in young and aged mice. (C) Aged B6 mice were inoculated with 6–8 × 10⁶ NKY cells, TCD8+Y cells, or NK cell–depleted splenocytes from young mice (NK-Y) and infected with 50 PFU ECTV. Mice were observed daily for signs of disease and death. Data combines four individual experiments. Statistical analysis was obtained with the Log-Rank test. (D) Aged B6 mice were inoculated with 5 × 10⁶ purified TCD8+Y cells (white columns) or NKY cells (gray columns) and infected with 50 PFU ECTV. Virus titers in these were determined in the indicated organs 5 dpi. Data correspond to the mean ± SD of five individual mice per group.

Similar articles

Cited by

References

    1. Basta S., Chen W., Bennink J.R., Yewdell J.W. 2002. Inhibitory effects of cytomegalovirus proteins US2 and US11 point to contributions from direct priming and cross-priming in induction of vaccinia virus-specific CD8(+) T cells. J. Immunol. 168:5403–5408 - PubMed
    1. Bray M., Martinez M., Smee D.F., Kefauver D., Thompson E., Huggins J.W. 2000. Cidofovir protects mice against lethal aerosol or intranasal cowpox virus challenge. J. Infect. Dis. 181:10–19 10.1086/315190 - DOI - PubMed
    1. Chaudhri G., Panchanathan V., Bluethmann H., Karupiah G. 2006. Obligatory requirement for antibody in recovery from a primary poxvirus infection. J. Virol. 80:6339–6344 10.1128/JVI.00116-06 - DOI - PMC - PubMed
    1. Chen W., Drillien R., Spehner D., Buller R.M. 1992. Restricted replication of ectromelia virus in cell culture correlates with mutations in virus-encoded host range gene. Virology. 187:433–442 10.1016/0042-6822(92)90445-U - DOI - PubMed
    1. Chen S., Kawashima H., Lowe J.B., Lanier L.L., Fukuda M. 2005. Suppression of tumor formation in lymph nodes by L-selectin–mediated natural killer cell recruitment. J. Exp. Med. 202:1679–1689 10.1084/jem.20051473 - DOI - PMC - PubMed

Publication types