. 2010 Nov;154(3):1514-31.
doi: 10.1104/pp.110.161869. Epub 2010 Sep 27.

Ethylene suppression of sugar-induced anthocyanin pigmentation in Arabidopsis

Affiliations

Ethylene suppression of sugar-induced anthocyanin pigmentation in Arabidopsis

Seok-Won Jeong et al. Plant Physiol. 2010 Nov.

Abstract

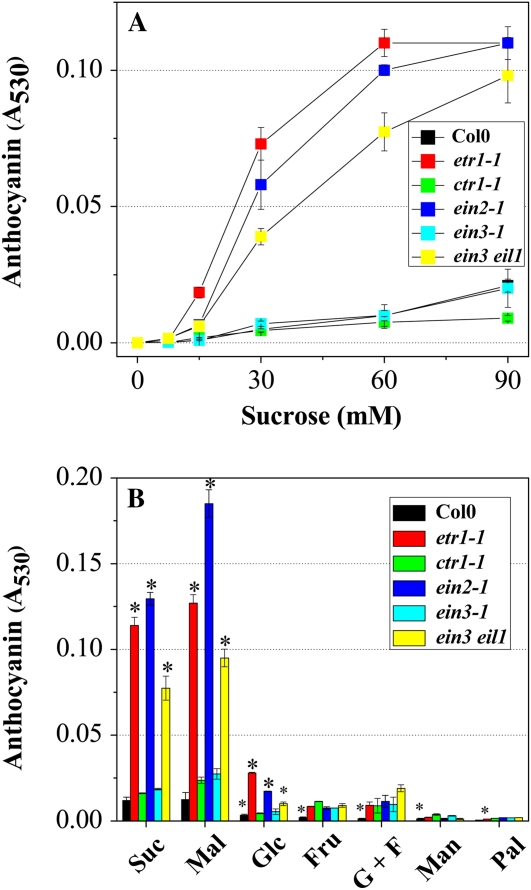
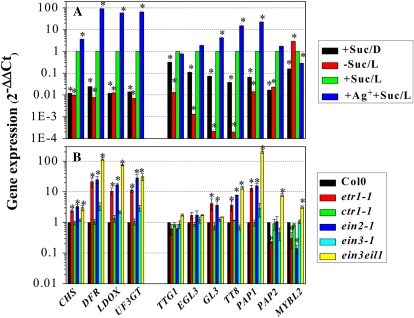
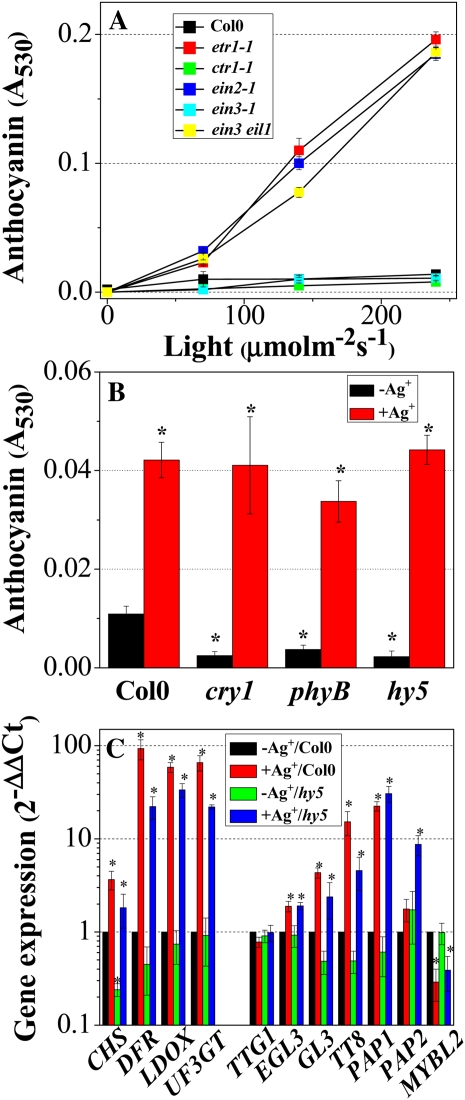
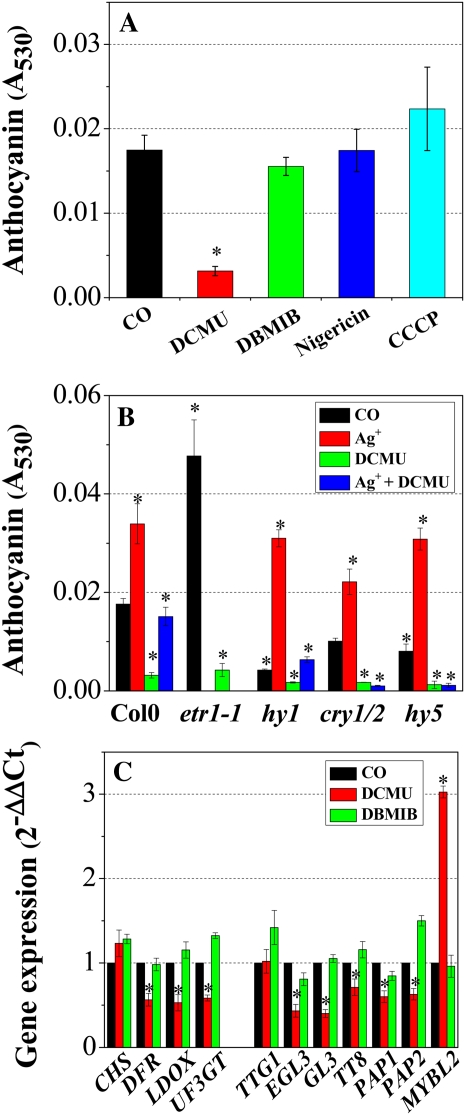
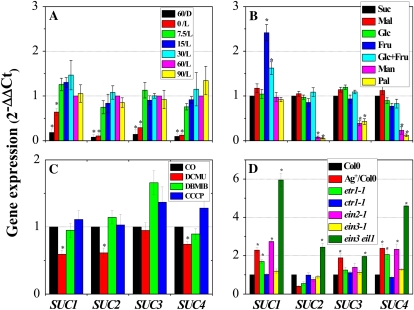
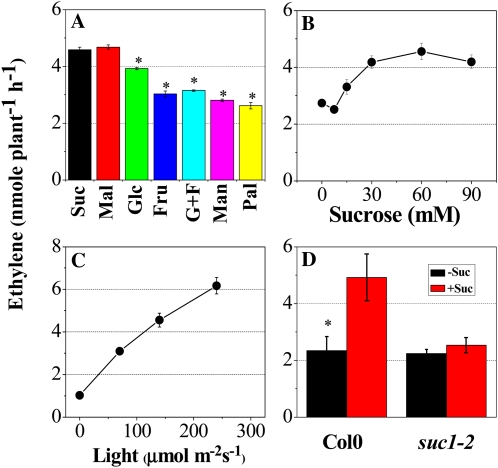
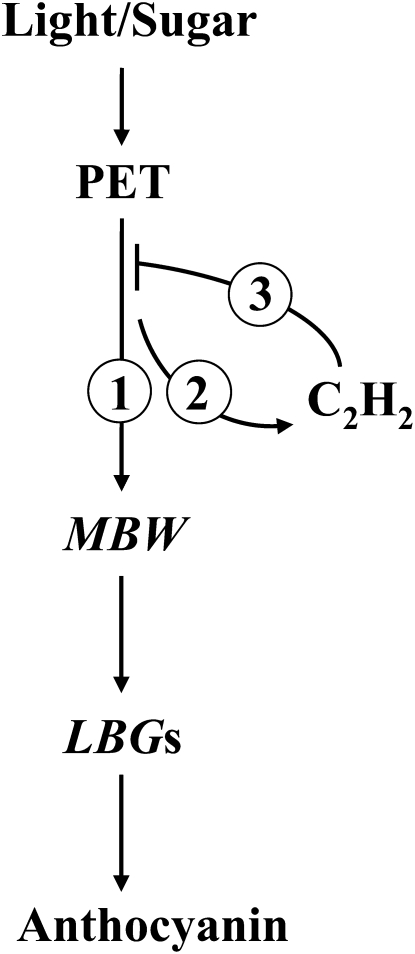
Anthocyanin accumulation is regulated negatively by ethylene signaling and positively by sugar and light signaling. However, the antagonistic interactions underlying these signalings remain to be elucidated fully. We show that ethylene inhibits anthocyanin accumulation induced by sucrose (Suc) and light by suppressing the expression of transcription factors that positively regulate anthocyanin biosynthesis, including GLABRA3, TRANSPARENT TESTA8, and PRODUCTION OF ANTHOCYANIN PIGMENT1, while stimulating the concomitant expression of the negative R3-MYB regulator MYBL2. Genetic analyses show that the ethylene-mediated suppression of anthocyanin accumulation is dependent upon ethylene signaling components responsible for the triple response. Furthermore, these positive and negative signaling pathways appear to be under photosynthetic control. Suc and light induction of anthocyanin accumulation was almost fully inhibited in wild-type Arabidopsis (Arabidopsis thaliana) ecotype Columbia and ethylene (ethylene response1 [etr1-1]) and light (long hypocotyl1 [hy1], cryptochrome1/2, and hy5) signaling mutants treated with the photosynthetic electron transport inhibitor 3-(3,4-dichlorophenyl)-1,1-dimethylurea. The transcript level of the sugar transporter gene SUC1 was enhanced in ecotype Columbia treated with the ethylene-binding inhibitor silver and in etr1-1, ethylene insensitive2 (ein2-1), and ein3 ein3-like1 mutants. In contrast, 3-(3,4-dichlorophenyl)-1,1-dimethylurea treatment reduced SUC1 expression, which indicates strongly that SUC1 represents an integrator for signals provided by sugar, light, and ethylene. SUC1 mutations lowered accumulations of anthocyanin pigment, soluble sugar content, and ethylene production in response to Suc and light signals. These data demonstrate that the suppression of SUC1 expression by ethylene inhibits Suc-induced anthocyanin accumulation in the presence of light and, hence, fine-tunes anthocyanin homeostasis.


Figures

Figure 1.
Figure 1.
Anthocyanin contents in Col0 and ethylene receptor and signaling mutants. A, Images of representative seedlings of Col0 and ethylene signaling mutants (etr1-1, ctr1-1, ein2-1, ein3-1, and ein3 eil1). B, Images of the abaxial side (left) and of the transverse (right, top) and longitudinal (right, bottom) sections of a rosette leaf from a representative ein2-1 plant. Bars = 500 μm (left), 200 μm (right, top), and 100 μm (right, bottom). In A and B, plants were grown for 12 d on half-strength MS medium containing 60 mm Suc under illumination (140 μmol m−2 s−1). C, Anthocyanin contents in Col0, ethylene receptor family mutants (etr1-1, ers1-2, etr2-1, ers2-1, and ein4), ETR1 mutant alleles (etr1-1, etr1-2, etr1-3, etr1-4, and etr1-7), and signaling mutant plants. Plants were grown on half-strength MS medium containing 60 mm Suc supplemented with 10 μm ACC (ACC), 10 μm AVG (AVG), 1 mm AgNO3 (Ag+), or without (CO for Col0 and ethylene mutants) the inhibitors indicated and incubated for 12 d under illumination (140 μmol m−2 s−1). Error bars represent sd values for the means of four or five independent replicates. Asterisks over bars indicate differences between control (CO) and treatment or between Col0 and mutants, with statistical significance set at P < 0.05 (t test). [See online article for color version of this figure.]
Figure 2.
Figure 2.
Induction of anthocyanin in Col0 and ethylene signaling mutants (etr1-1, ctr1-1, ein2-1, ein3-1, and ein3 eil1). A, Anthocyanin accumulates in plants as a function of Suc concentration. B, Effects of various sugars on anthocyanin content. Plants were grown on half-strength MS medium supplemented with various concentrations of Suc (0, 7.5, 15, 30, 60, and 90 mm; A) or with metabolic sugars such as Suc (60 mm), Mal (60 mm), Glc (60 mm), or Fru (60 mm), a 1:1 mixture of Glc:Fru (G+F; 30 mm Glc and 30 mm Fru), a sugar alcohol, Man (60 mm), or a nonmetabolic sugar, Pal (60 mm; B) for 12 d under light conditions of 140 μmol m−2 s−1. In A, the black square for Col0 is hardly visible because it overlaps with symbols for ein3-1 or ein3 eil1 mutants. Error bars represent sd values for the means of three or four independent replicates. Asterisks over bars indicate differences between control (60 mm Suc) and treatment (other sugars) or between Col0 and mutants, with statistical significance set at P < 0.05 (t test). [See online article for color version of this figure.]
Figure 3.
Figure 3.
Transcript levels of structural (CHS, DFR, LDOX, and UF3GT) and regulatory (TTG1, EGL3, GL3, TT8, PAP1, PAP2, and MYBL2) genes involved in anthocyanin biosynthesis in Col0 and ethylene signaling mutants (etr1-1, ctr1-1, ein2-1, ein3-1, and ein3 eil1). A, Col0 plants were grown on half-strength MS medium supplemented with (+Suc) or without (−Suc) 60 mm Suc in the presence of 1 mm AgNO3 (+Ag+). Seedlings were incubated for 12 d in continuous darkness (D) or under light (L; 140 μmol m−2 s−1) conditions. B, Plants were grown on half-strength MS medium supplemented with 60 mm Suc for 12 d under light. Transcript levels were quantified by reverse transcription (RT)-qPCR (for details, see “Materials and Methods”). Error bars represent sd values for the means of three or four independent replicates. Asterisks over bars indicate differences between control (+Suc/L) and treatment (A) or between Col0 and mutants (B), with statistical significance set at P < 0.05 (t test). [See online article for color version of this figure.]
Figure 4.
Figure 4.
Anthocyanin contents and transcript levels of anthocyanin biosynthesis-related genes in Col0, ethylene signaling mutants (etr1-1, ctr1-1, ein2-1, ein3-1, and ein3 eil1), and anthocyanin biosynthesis-related light signaling mutants (cry1, phyB, and hy5). A, Anthocyanin contents of Col0 and ethylene signaling mutants grown at various light intensities. B, Anthocyanin contents in Col0 and light signaling mutants. C, Transcript levels of structural (CHS, DFR, LDOX, and UF3GT) and regulatory (TTG1, EGL3, GL3, TT8, PAP1, PAP2, and MYBL2) genes in Col0 and the hy5 mutant. Transcript levels were quantified by RT-qPCR. Plants were grown for 12 d on half-strength MS medium containing 60 mm Suc under various light intensities (0, 70, 140, and 240 μmol m−2 s−1; A) or complemented with (+Ag+) or without (−Ag+) 1 mm AgNO3 under growth light conditions (140 μmol m−2 s−1; B and C). Error bars represent sd values for the means of three or four independent replicates. Asterisks over bars indicate differences between control (−Ag+/Col0) and treatment or between Col0 and mutants, with statistical significance set at P < 0.05 (t test). [See online article for color version of this figure.]
Figure 5.
Figure 5.
Effects of photosynthesis inhibitors on anthocyanin content and transcript levels of anthocyanin biosynthesis genes in Col0, an ethylene receptor mutant (etr1-1), and light signaling mutants (hy1, cry1/2, and hy5). A, Anthocyanin accumulation in Col0 in the presence of various photosynthesis inhibitors. B, Anthocyanin accumulation in Col0, ethylene receptor mutant, and light signaling mutants in the presence of silver or the photosynthesis inhibitor DCMU. C, Transcript levels of structural (CHS, DFR, LDOX, and UF3GT) and regulatory (TTG1, EGL3, GL3, TT8, PAP1, PAP2, and MYBL2) genes in Col0 in the presence of the photosynthesis inhibitors DCMU and DBMIB. Transcript levels were quantified by RT-qPCR. Nine-day-old seedlings grown on half-strength MS medium containing 7.5 mm Glc were transferred to filter papers soaked with liquid growth medium containing 60 mm Suc supplemented with 10 μm DCMU (DCMU), 5 μm DBMIB (DBMIB), 5 μm nigericin (Nigericin), 5 μm CCCP (CCCP), 1 mm AgNO3 (Ag+), or a mixture of 1 mm AgNO3 and 10 μm DCMU (Ag+ + DCMU) or without (CO) the inhibitors indicated and then incubated for 2 d under growth light conditions (140 μmol m−2 s−1). Anthocyanin content was not measured for silver-treated etr1-1 mutants, in which ethylene signaling is intrinsically blocked by ETR1 mutation. Error bars represent sd values for the means of three or four independent replicates. Asterisks over bars indicate differences between control (CO) and treatment (DCMU, DBMIB, nigericin, CCCP, silver) or between Col0 and mutants, with statistical significance set at P < 0.05 (t test). [See online article for color version of this figure.]
Figure 6.
Figure 6.
Transcript levels of SUC genes in Col0 and ethylene signaling mutants (etr1-1, ctr1-1, ein2-1, ein3-1, and ein3 eil1). A, Transcript levels of SUC genes in Col0 plants grown under various concentrations of Suc. B, Effects of various sugars on the transcript levels of SUC genes in Col0. C, Effects of photosynthesis inhibitors on the transcript levels of SUC genes in Col0. D, Transcript levels of SUC genes in Col0 and ethylene signaling mutants. For A, B, and D, plants were grown for 12 d on half-strength MS medium supplemented with various concentrations of Suc (0, 7.5, 15, 30, 60, and 90 mm) or various sugars (see Fig. 2B legend) in the dark (D) or under light (L; 140 μmol m−2 s−1) with (Ag+) or without 1 mm AgNO3. C, Growth and treatment conditions were as described in the legend to Figure 5. Transcript levels were quantified by RT-qPCR. Error bars represent sd values for the means of three to four independent replicates. Asterisks over bars indicate differences between control (60/L in A and Suc in B) and treatment or between Col0 and mutants, with statistical significance set at P < 0.05 (t test). [See online article for color version of this figure.]
Figure 7.
Figure 7.
Anthocyanin and sugar contents in Col0 and the Suc transporter (suc1-2), the ethylene receptor (etr1-1), and the signaling (ein2-1) mutants. A, Anthocyanin contents in Col0 and suc1-2 mutants. B and C, Soluble sugar (Glc, Fru, and Suc) contents in Col0, suc1-2, etr1-1, and ein2-1 plants. For A and C, 9-d-old plants grown on half-strength MS medium containing 7.5 mm Glc were transferred to filter papers soaked with liquid growth medium containing either 0 (−Suc) or 60 mm Suc (CO) complemented with 1 mm AgNO3 (Ag+), 10 μm DCMU (DCMU), or a mixture of 1 mm AgNO3 and 10 μm DCMU (Ag+ + DCMU) or without the inhibitors indicated and incubated for 2 d under growth light conditions (140 μmol m−2 s−1). For B, plants were grown for 12 d on half-strength MS medium supplemented with 60 mm Suc under growth light conditions (140 μmol m−2 s−1). Error bars represent sd values for the means of four or five independent replicates. Asterisks over bars indicate differences between control (CO) and treatment or between Col0 and mutants, with statistical significance set at P < 0.05 (t test). [See online article for color version of this figure.]
Figure 8.
Figure 8.
Relative changes in sugars, anthocyanin, and ethylene contents in Col0. Nine-day-old plants grown on half-strength MS medium supplemented with 7.5 mm Glc under illumination (140 μmol m−2 s−1) were transferred to filter papers soaked with liquid growth medium containing 60 mm Suc and incubated for a further 2 d. After 48 h of treatment, the anthocyanin, sugar, and ethylene contents were 0.019 ± 0.001, 7.81 ± 0.73, and 4.92 ± 0.90 nmol plant−1 h−1, respectively. Error bars represent sd values for the means of three or four independent replicates. [See online article for color version of this figure.]
Figure 9.
Figure 9.
Sugar- and light-dependent ethylene production in Col0 and suc1-2 mutants. A, Ethylene produced from Col0 plants grown on half-strength MS medium supplemented with various metabolic and nonmetabolic sugars (see Fig. 2B legend). B, Ethylene produced from Col0 plants cultured on growth medium containing various concentrations of Suc (mm) for 12 d under illumination (140 μmol m−2 s−1). C, Ethylene produced from Col0 plants cultured on growth medium containing 60 mm Suc for 12 d under different light intensities (0, 70, 140, and 240 μmol m−2 s−1). D, Ethylene produced from Col0 and suc1-2 mutants cultured on growth medium containing 7.5 mm Glc (−Suc) or 60 mm Suc (+Suc) for 12 d under illumination (140 μmol m−2 s−1). Error bars represent sd values for the means of three or four independent replicates. Asterisks over bars indicate differences between control (Suc) and treatment or between Col0 and mutants, with statistical significance set at P < 0.05 (t test). [See online article for color version of this figure.]
Figure 10.
Figure 10.
Schematic diagram of the relationship between light, Suc, ethylene signals, and anthocyanin biosynthesis. Step 1, Light and sugar signals generated from photosynthetic electron transport (PET) activates the MBW regulatory complex. It also down-regulates MybL2 expression, which in turn leads to the specific up-regulation of several LBGs, resulting in the accumulation of anthocyanin. Step 2, At the same time, sugar stimulates ethylene production in the presence of light. Step 3, This, in turn, triggers the repression of anthocyanin biosynthesis by interfering with the light-induced sugar signaling that is at least partially mediated by SUC1. The ethylene signaling pathway comprises the ethylene receptors CTR1, EIN2, EIN3, and EIL1.

Similar articles

Cited by

References

    1. Ahmad M, Cashmore AR. (1997) The blue-light receptor cryptochrome 1 shows functional dependence on phytochrome A or phytochrome B in Arabidopsis thaliana. Plant J 11: 421–427 - PubMed
    1. Albert NW, Lewis DH, Zhang H, Irving LJ, Jameson PE, Davies KM. (2009) Light-induced vegetative anthocyanin pigmentation in Petunia. J Exp Bot 60: 2191–2202 - PMC - PubMed
    1. Aoki N, Hirose T, Takahashi S, Ono K, Ishimaru K, Ohsugi R. (1999) Molecular cloning and expression analysis of a gene for a sucrose transporter in maize (Zea mays L.). Plant Cell Physiol 40: 1072–1078 - PubMed
    1. Baier M, Hemmann G, Holman R, Corke F, Card R, Smith C, Rook F, Bevan MW. (2004) Characterization of mutants in Arabidopsis showing increased sugar-specific gene expression, growth, and developmental responses. Plant Physiol 134: 81–91 - PMC - PubMed
    1. Barker L, Kühn C, Weise A, Schulz A, Gebhardt C, Hirner B, Hellmann H, Schulze W, Ward JM, Frommer WB. (2000) SUT2, a putative sucrose sensor in sieve elements. Plant Cell 12: 1153–1164 - PMC - PubMed

Publication types