. 2010 Nov 26;285(48):37927-38.
doi: 10.1074/jbc.M110.168989. Epub 2010 Sep 27.

InsP3R-associated cGMP kinase substrate determines inositol 1,4,5-trisphosphate receptor susceptibility to phosphoregulation by cyclic nucleotide-dependent kinases

Affiliations

InsP3R-associated cGMP kinase substrate determines inositol 1,4,5-trisphosphate receptor susceptibility to phosphoregulation by cyclic nucleotide-dependent kinases

Wataru Masuda et al. J Biol Chem. .

Abstract

Ca(2+) release through inositol 1,4,5-trisphosphate receptors (InsP(3)R) can be modulated by numerous factors, including input from other signal transduction cascades. These events shape the spatio-temporal characteristics of the Ca(2+) signal and provide fidelity essential for the appropriate activation of effectors. In this study, we investigate the regulation of Ca(2+) release via InsP(3)R following activation of cyclic nucleotide-dependent kinases in the presence and absence of expression of a binding partner InsP(3)R-associated cGMP kinase substrate (IRAG). cGMP-dependent kinase (PKG) phosphorylation of only the S2+ InsP(3)R-1 subtype resulted in enhanced Ca(2+) release in the absence of IRAG expression. In contrast, IRAG bound to each InsP(3)R subtype, and phosphorylation of IRAG by PKG attenuated Ca(2+) release through all InsP(3)R subtypes. Surprisingly, simply the expression of IRAG attenuated phosphorylation and inhibited the enhanced Ca(2+) release through InsP(3)R-1 following cAMP-dependent protein kinase (PKA) activation. In contrast, IRAG expression did not influence the PKA-enhanced activity of the InsP(3)R-2. Phosphorylation of IRAG resulted in reduced Ca(2+) release through all InsP(3)R subtypes during concurrent activation of PKA and PKG, indicating that IRAG modulation is dominant under these conditions. These studies yield mechanistic insight into how cells with various complements of proteins integrate and prioritize signals from ubiquitous signaling pathways.


Figures

FIGURE 1.
FIGURE 1.
Interaction of InsP3R with IRAG and PKG1β in COS-7 cells. The proteins indicated in the figure were transiently expressed in COS-7 cells. Immune complexes were captured by immunoprecipitation (IP) from cell lysates with α-GFP monoclonal antibody. In A, lanes 1–4 show the input, representing 5% of the lysate prior to immunoprecipitation. Immunoprecipitated samples were subjected to Western blot analysis (IB) for detection of S2+/S2− InsP3R-1, PKG1β, and IRAG(GFP) or IRAGΔE12(GFP) (lanes 5–8). Both splice variants of InsP3R1 were co-immunoprecipitated only in the presence of full-length IRAG (lanes 5 and 7). In contrast, PKG1β was co-immunoprecipitated with antibody independent of IRAG type. In B, immunoprecipitated samples were subjected to Western blot analysis for detection of InsP3R-2, PKG1β, and IRAG(GFP) or IRAGΔE12(GFP). Lanes 1 and 2 show input representing 5% of the sample. InsP3R-2 was co-immunoprecipitated with antibody only in the presence of full-length IRAG (lane 3). In contrast, PKG1β was co-immunoprecipitated with antibody independent of IRAG type. In C, immunoprecipitated samples were subjected to Western blot analysis for detection of InsP3R-3, PKG1β, and IRAG(GFP) or IRAGΔE12(GFP). Lanes 1 and 2 show input representing 5% of the sample. InsP3R-3 was co-immunoprecipitated with antibody only in the presence of wild type IRAG (lane 3). In contrast, PKG1β was co-immunoprecipitated with antibody independent of IRAG type. Results presented are representative of at least three independent similar experiments.
FIGURE 2.
FIGURE 2.
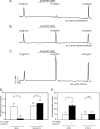
Ca2+ release through S2− InsP3R-1 is attenuated by PKG activation in cells expressing IRAG/PKG1β. DT40-3KO cells stably expressing S2− InsP3R-1 were transfected with cDNA encoding M3R, IRAG(GFP) in A or IRAGΔE12(GFP) in B, and PKG1β. Transient Ca2+ release was induced by 30-s exposure to 70 nm CCh. In A, treatment with 20 μm PET-cGMP resulted in a markedly attenuated CCh-induced Ca2+ release in the presence of wild type IRAG. In B, no effect of incubation with PET-cGMP was observed in the presence of IRAGΔE12. C, pooled data. In each set of experiments, experimental runs were performed without PKA/PKG activators/inhibitors to gauge the reproducibility of the agonist responses. Data in the open bars represent the -fold change of the second response compared with the first response in the absence of treatment. The filled bars show the normalized -fold increase of the second peak over the first peak for the indicated experimental condition. Columns represent mean ± S.E. (error bars). **, p < 0.0001; NS, not statistically significant. The number of cells in each condition is indicated in parentheses.
FIGURE 3.
FIGURE 3.
Ca2+ release through S2+ InsP3R-1 is attenuated by PKG activation in cells expressing IRAG/PKG1β. DT40-3KO cells stably expressing S2+ InsP3R-1 were transfected with cDNA encoding M3R, IRAG(GFP) in A or IRAGΔE12(GFP) in B, and PKG1β. In A, treatment with 20 μm PET-cGMP resulted in a markedly attenuated CCh-induced Ca2+ release in the presence of full-length IRAG. In contrast, in B, in cells expressing IRAGΔ12(GFP), a small but statistically significant increase in CCh-induced Ca2+ release was observed. In C, in the absence of IRAG expression, PET-cGMP resulted in a marked potentiation of the CCh-induced Ca2+ release. D and E show the pooled data in the presence and absence of full-length IRAG expression, respectively. Data in the open bars represent the -fold change of the second response compared with the first response in the absence of treatment. The filled bars show the normalized -fold increase of the second peak over the first peak for the indicated experimental condition. Columns represent mean ± S.E. (error bars). **, p < 0.0001; ***, p < 0.05; NS, not statistically significant. The number of cells in each condition is indicated in parentheses.
FIGURE 4.
FIGURE 4.
Ca2+ release through InsP3R-2 is attenuated by PKG activation in cells expressing IRAG/PKG1β. DT40-3KO cells stably expressing InsP3R-2 were transfected with cDNA encoding M3R, IRAG(GFP) in A and B or IRAGΔE12(GFP) in C, and PKG1β. In A, treatment with 20 μm PET-cGMP resulted in a markedly attenuated CCh-induced Ca2+ release in the presence of full-length IRAG. In B, this attenuation was significantly reduced by pretreatment with the PKG inhibitor, Rp-8-Br-PET-cGMP. In C, no effect of incubation with PET-cGMP was observed in the presence of IRAGΔE12. D, pooled data. Data in the open bars represent the -fold change of the second response compared with the first response in the absence of treatment. The filled bars show the normalized -fold increase of the second peak over the first peak for the indicated experimental condition. Columns represent mean ± S.E. (error bars). **, p < 0.0001; ***, p < 0.05; NS, not statistically significant. The number of cells in each condition is indicated in parentheses.
FIGURE 5.
FIGURE 5.
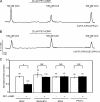
Ca2+ release through InsP3R-3 is attenuated by PKG activation in cells expressing IRAG/PKG1β. DT40-3KO cells stably expressing InsP3R-3 were transfected with cDNA encoding M3R, IRAG(GFP) in A or IRAGΔE12(GFP) in B, and PKG1β. In A, treatment with 20 μm PET-cGMP resulted in a markedly attenuated CCh-induced Ca2+ release in the presence of full-length IRAG. In B, no effect of incubation with PET-cGMP was observed in the presence of IRAGΔE12. C, pooled data. Data in the open bars represent the -fold change of the second response compared with the first response in the absence of treatment. The filled bars show the normalized -fold increase of the second peak over the first peak for the indicated experimental condition. Columns represent mean ± S.E. (error bars). *, p < 0.0001; NS, not statistically significant. The number of cells in each condition is indicated in parentheses.
FIGURE 6.
FIGURE 6.
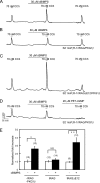
PKA activation fails to enhance Ca2+ release through S2- InsP3R-1 in the presence of IRAG/PKG1β. DT40-3KO cells stably expressing S2− InsP3R-1 were transfected with cDNA encoding M3R and IRAG(GFP) in B and D or IRAGΔE12(GFP) in C, together with PKG1β in B and C. In A, treatment with 30 μm cBIMPS resulted in a significantly enhanced CCh-induced Ca2+ release in the absence of IRAG and PKG1β. In B, no effect of cBIMPS treatment was observed in cells expressing full-length IRAG. In C, cBIMPS incubation resulted in a markedly enhanced CCh-induced Ca2+ release in cells expressing IRAGΔE12(GFP). In D, cBIMPS treatment did not alter CCh-induced Ca2+ release; however, subsequent incubation with the cGMP analog PET-cGMP resulted in significant attenuation of Ca2+ release. E, pooled data. Data in the open bars represent the -fold change of the second response compared with the first response in the absence of treatment. The filled bars show the normalized -fold increase of the second peak over the first peak for the indicated experimental condition. Columns represent mean ± S.E. (error bars). *, p < 0.001; ****, p < 0.01; NS, not statistically significant. The number of cells in each condition is indicated in parentheses.
FIGURE 7.
FIGURE 7.
IRAG expression reduces PKA-induced phosphorylation of S2−/S2+ InsP3R-1. COS-7 cells were transfected with cDNA encoding S2− InsP3R-1 in A or S2+ InsP3R-1 in B, together with IRAG(GFP) or IRAGΔE12(GFP) and PKG1β. Analysis of phospho-InsP3R band densities for three experiments is shown in the right-hand panels for each splice variant; although the expression level of InsP3R was reduced by the transfection of IRAG, the amount of InsP3R when analyzed in each treatment group was not significantly different, and thus the -fold change in each group is shown. Cells were treated with 10 μm forskolin and 200 μm isobutylmethylxanthine for 10 min at room temperature prior to cell lysis. Protein was subjected to SDS-PAGE and then Western blotting for the indicated proteins. Phosphorylation of S2− InsP3R-1 in A and S2+ InsP3R-1 in B was diminished in the presence of full-length IRAG (compare lanes 1 and 2 with lanes 3 and 4). In contrast, the extent of phosphorylation was largely unaltered by expression of IRAGΔE12(GFP) (lanes 5 and 6). Error bars, S.E, p < 0.05.
FIGURE 8.
FIGURE 8.
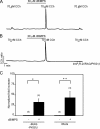
PKA activation enhances Ca2+ release through InsP3R-2 in the presence of IRAG/PKG1β. DT40-3KO cells stably expressing InsP3R-2 were transfected with cDNA encoding M3R in A or IRAG(GFP) and PKG1β in B. In A, treatment with the PKA activator cBIMPS resulted in a marked enhancement of CCh-induced Ca2+ release. In B, expression of full-length IRAG did not alter the effect of PKA activation. C, pooled data. Data are expressed as the normalized -fold increase of the second peak over the first peak. Columns represent mean ± S.E. (error bars). **, p < 0.01; ****, p < 0.05. The number of cells in each condition is indicated in parentheses.
FIGURE 9.
FIGURE 9.
IRAG phosphorylation by PKG exerts a dominant effect over PKA phosphorylation of InsP3R-2. DT40-3KO cells stably expressing InsP3R-2 were transfected with cDNA encoding M3R, IRAG(GFP), and PKG1β. In A, treatment with the PKA activator cBIMPS resulted in a marked enhancement of CCh-induced Ca2+ release, which was maintained in the continued presence of the agent. In B, subsequent activation of PKG in the continued presence of cBIMPS results in the marked attenuation of the CCh-induced Ca2+ release. The experiment shown is typical of three others.

Similar articles

Cited by

References

    1. Berridge M. J., Bootman M. D., Roderick H. L. (2003) Nat. Rev. Mol. Cell Biol. 4, 517–529 - PubMed
    1. Patterson R. L., Boehning D., Snyder S. H. (2004) Annu. Rev. Biochem. 73, 437–465 - PubMed
    1. Conti M., Beavo J. (2007) Annu. Rev. Biochem. 76, 481–511 - PubMed
    1. Willoughby D., Cooper D. M. (2007) Physiol. Rev. 87, 965–1010 - PubMed
    1. Berridge M. J., Lipp P., Bootman M. D. (2000) Nat. Rev. Mol. Cell Biol. 1, 11–21 - PubMed

Publication types

LinkOut - more resources