. 2010 Nov;137(21):3651-61.
doi: 10.1242/dev.051094. Epub 2010 Sep 28.

Three-dimensional cartography of hematopoietic clusters in the vasculature of whole mouse embryos

Affiliations

Three-dimensional cartography of hematopoietic clusters in the vasculature of whole mouse embryos

Tomomasa Yokomizo et al. Development. 2010 Nov.

Abstract

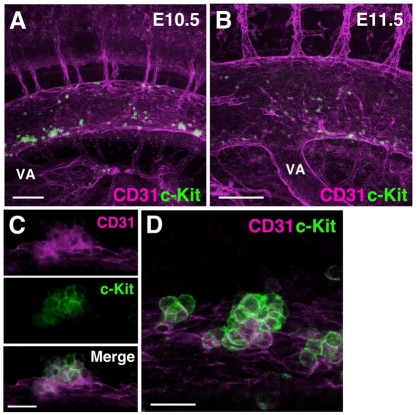
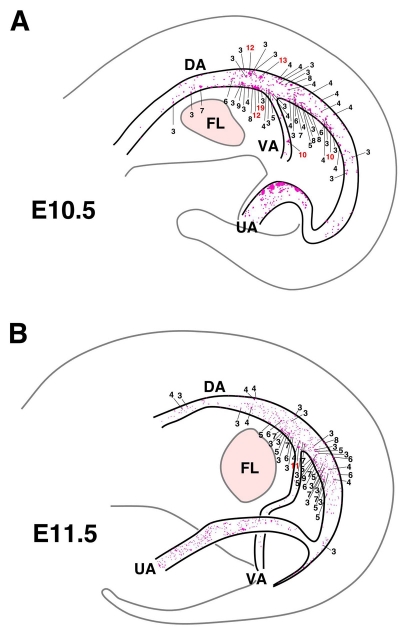
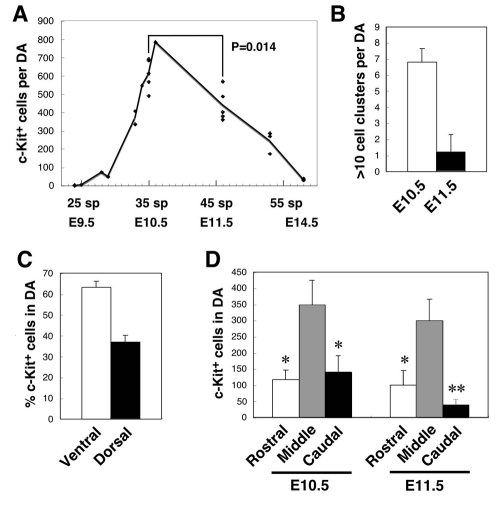
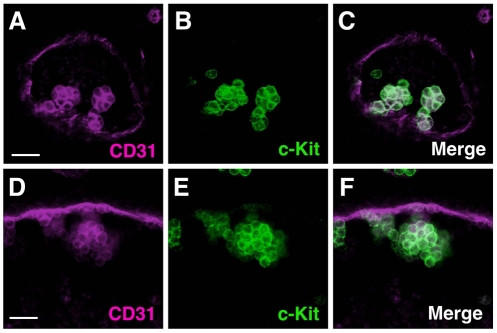
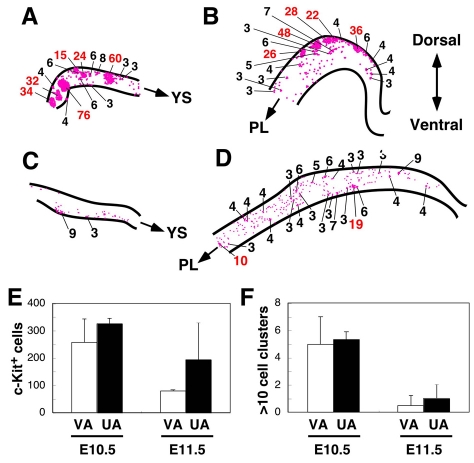
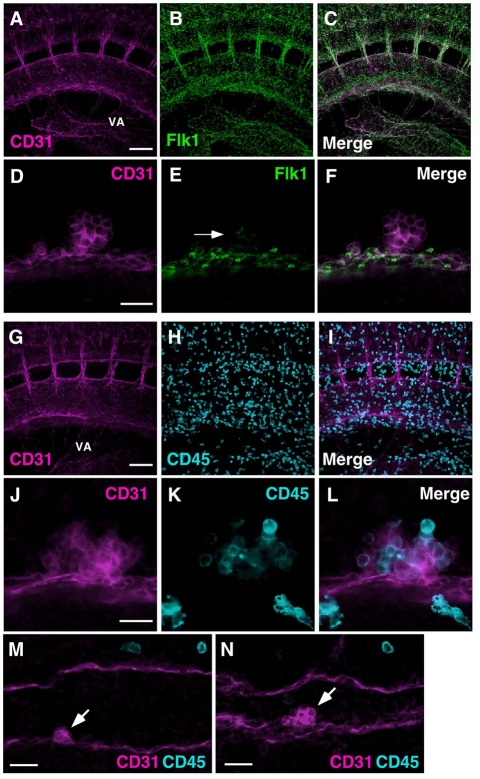
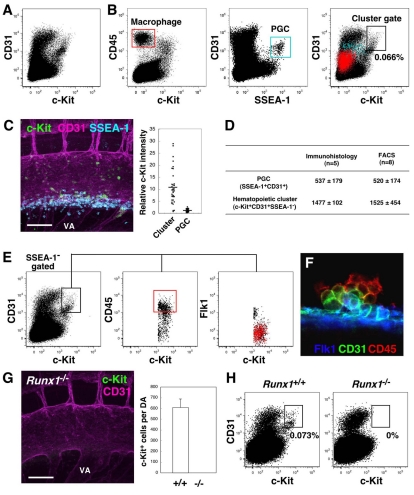
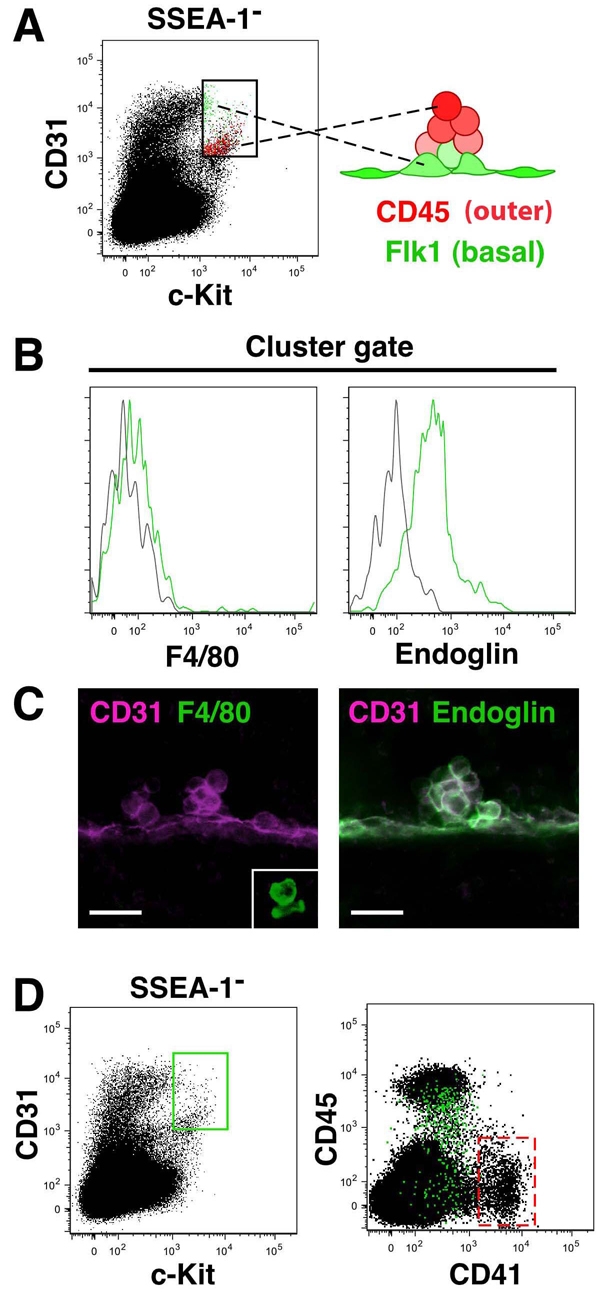
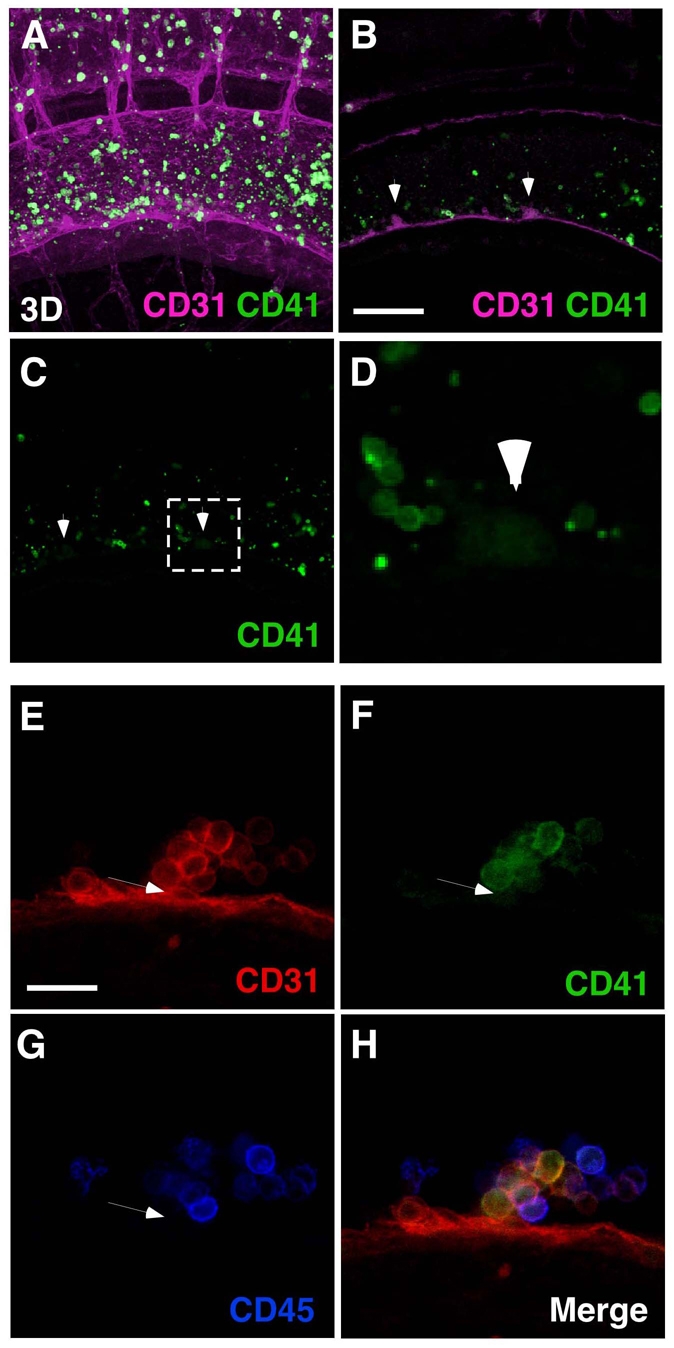
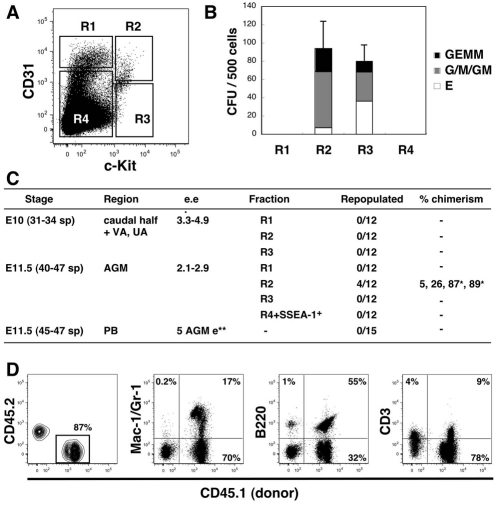
Hematopoietic cell clusters in the aorta of vertebrate embryos play a pivotal role in the formation of the adult blood system. Despite their importance, hematopoietic clusters have not been systematically quantitated or mapped because of technical limitations posed by the opaqueness of whole mouse embryos. Here, we combine an approach to make whole mouse embryos transparent, with multicolor marking, to allow observation of hematopoietic clusters using high-resolution 3-dimensional confocal microscopy. Our method provides the first complete map and temporal quantitation of all hematopoietic clusters in the mouse embryonic vasculature. We show that clusters peak in number at embryonic day 10.5, localize to specific vascular subregions and are heterogeneous, indicating a basal endothelial to non-basal (outer cluster) hematopoietic cell transition. Clusters enriched with the c-Kit(+)CD31(+)SSEA1(-) cell population contain functional hematopoietic progenitors and stem cells. Thus, three-dimensional cartography of transparent mouse embryos provides novel insight into the vascular subregions instrumental in hematopoietic progenitor/stem cell development, and represents an important technological advancement for comprehensive in situ hematopoietic cluster analysis.


Figures

Fig. 1.
Fig. 1.
Three-dimensional analysis of aortic hematopietic clusters. (A) Confocal image of c-Kit and CD31 expression in the mouse aorta region at E10.5 (35 sp) and (B) E11.5. c-Kit+ clusters (green) are attached to CD31+ endothelial cell layer (magenta). Scale bars: 100 μm. See Movie 1 in the supplementary material for E10.5 and Movie 2 for E11.5 3D images. (C) Representative cluster stained for CD31 and c-Kit expression. CD31 is expressed by both endothelial cells and hematopoietic clusters (magenta, top panel), and c-Kit is expressed by hematopoietic cluster cells (middle panel). Merged fluorescence (bottom panel). Scale bar: 20 μm. (D) Higher magnification image of hematopoietic clusters at 35 sp. Scale bar: 20 μm. VA, vitelline artery.
Fig. 2.
Fig. 2.
Spatio-temporal mapping of aortic hematopoietic clusters. (A,B) Cartographic distribution of c-Kit+ cells within mouse aorta at (A) E10.5 and (B) E11.5. Each dot represents one c-Kit+ cell, with numbers indicating c-Kit+ cells per cluster (except for single and two cell clusters). Red numbers indicate clusters with more than 10 cells. Concentrations of clusters are found around the middle segment of the aorta (see Fig. S5 in the supplementary material). Maps are made from whole-mount immunostaining with DAB. DA, dorsal aorta; FL, fetal liver; UA, umbilical artery; VA, vitelline artery.
Fig. 3.
Fig. 3.
Spatio-temporal quantitation of mouse hematopoietic clusters. (A) Number of aortic c-Kit+ cells/clusters at different times of development. Embryonic day (E) and somite pairs (sp) are indicated. (B) Number of aortic hematopoietic clusters with more than 10 cells at E10.5 (35 sp) and E11.5 (45-47 sp, TS19). Results are mean ± s.d. of five embryos. P<0.0001. (C) Percentage of c-Kit+ cells distributed dorsoventrally in E10.5 (35 sp) aorta. Results are mean ± s.d. of five embryos. P<0.0001. (D) Number of c-Kit+ cells distributed along the antero-posterior axis of aorta E10.5 and E11.5. Middle segment is 7 sp (see Fig. S5 in the supplementary material). Results are mean ± s.d. of five embryos (*P<0.001, **P<0.0001, compared with middle segment).
Fig. 4.
Fig. 4.
Hematopoietic clusters in mouse VA and UA. (A-F) Representative clusters in E10 (33 sp) (A-C) vitelline and (D-F) umbilical arteries. (A,D) CD31 (magenta) is expressed by both hematopoietic clusters and endothelial cells, and (B,E) c-Kit expression (green) specifically marks hematopoietic clusters. (C,F) Merged fluorescent images. Scale bars: 20 μm.
Fig. 5.
Fig. 5.
Cartography and quantitation of hematopoietic clusters in mouse VA and UA. Cartographic distribution of c-Kit+ cells within (A,C) VA (outside embryo proper) and UA (B,D) at E10.5 and E11.5, respectively. Each dot represents one c-Kit+ cell and the number of c-Kit+ cells per cluster is indicated (except single- and two-cell clusters). Red numbers indicate clusters with more than 10 cells. Arrows indicate blood flow direction to the yolk sac (YS) for VA and to the placenta (PL) for UA. Maps made from DAB whole-mount immunostaining. (E) Number of c-Kit+ cells in VA and UA at E10.5 and E11.5 (n=3 for E10.5 VA and E10.5/E11.5 UA; n=2 for E11.5 VA). (F) Number of large (more than 10 cells) hematopoietic clusters in E10.5/E11.5 VA and UA. VA, vitelline artery; UA, umbilical artery.
Fig. 6.
Fig. 6.
Heterogeneity within hematopoietic clusters. (A-L) Whole-mount immunostaining of E10.5 mouse embryos for (A-F) CD31 (magenta) and Flk1 expression (green), and (G-L) CD31 (magenta) and CD45 (blue) expression. Movie 3 in the supplementary material shows a 3D reconstruction of A-C,G-I. (D-F,J-L) High magnification of hematopoietic clusters. Only basal cells of hematopoietic clusters are positive for Flk1 (E, arrow). (M,N) Whole-mount immunostaining of E9.5 embryos for CD31 (magenta) and CD45 (blue) expression. Arrows indicate CD31+CD45 clusters. Scale bars: 100 μm in A,G; 20 μm in D,J,M,N. (A-F) 35 sp embryo. (G-L) 34 sp embryo. (M) 24 sp embryo. (N) 25 sp embryo. VA, vitelline artery.
Fig. 7.
Fig. 7.
Flow cytometric enrichment of mouse hematopoietic cluster cells. (A,B) FACS analysis of the caudal half region and of VA and UA cells at E10.5 (34-36 sp). (B) Red and blue dots in the right panel indicate macrophages and PGCs, respectively. No/few of these cells are present in the cluster gate. (C) Whole-mount immunostaining for c-Kit, CD31 and SSEA1 expression at E10.5 (36 sp). c-KitloCD31+SSEA1+ PGCs are localized ventrolaterally under aorta. Movie 4 in the supplementary material shows a 3D image. Scale bar: 100 μm. Graph shows relative intensity of c-Kit staining on cluster cells and SSEA1+ PGCs. (D) Quantification of PGCs and clusters in the caudal half region, and in the VA and UA using immunofluorescence and FACS analysis at E10.5 (34-36 sp). Average number per embryo is indicated. Numerous c-Kit+CD31+ cells are present in small vessels connected to VA (not shown) and are included in this quantification. (E) CD45 and Flk1 expression within the cluster gate. Most CD45hi cells (red box, middle panel) within the cluster gate are Flk1 negative (red dots, right panel). (F) Hematopoietic cluster stained with anti CD45, CD31 and Flk1 antibodies. (G) Whole-mount immunostaining of Runx1–/– embryo for c-Kit and CD31 expression. Scale bar: 100 μm. No c-Kit+ cells were observed in Runx1–/– aorta. Movie 5 in the supplementary material shows a 3D image. Graph shows the number of c-Kit+ cells part dorsal aorta (DA) from Runx1+/+ (E10.5, 35-37 sp) and Runx1–/– (E10.5, 35 and 36 sp); n=3. (H) FACS analysis of Runx1+/+ and Runx1–/– embryos. Cluster gate cells were absent in Runx1–/– embryos. Six Runx1–/– embryos (E10, 28-34 sp) analyzed gave consistent data. VA, vitelline artery.
Fig. 8.
Fig. 8.
FACS-based prediction of surface marker expression in mouse hematopoietic clusters. (A) Localization of CD45+ (outer) and Flk1+ (basal) cluster cells (right, a model made from Fig. 6 and Fig. 7F), and the cluster gate (left). FACS plot for CD31 and c-Kit shows Flk1+ (green) and CD45+ (red) cells within the cluster gate. (B) FACS profile showing no/low F4/80-expressing cells (green line) in the cluster gate (left panel) and endoglin (green line) expression on all cells (right panel) in cluster gate. The FACS plots predict expression of endoglin but not F4/80 within hematopoietic clusters of whole-mount immunostained embryos. (C) Confirmation of F4/80 and endoglin localized expression (green) within E10.5 hematopoietic clusters. CD31 is in magenta. Two clusters (left panel) are CD31+F4/80. Inset in left panel shows a CD31F4/80+ macrophage in the mesenchyme. Right panel shows a large CD31+endoglin+ cluster. Scale bars: 20 μm. (D) Prediction of CD41 expression within hematopoietic clusters. FACS profiles of the caudal half region, VA and UA cells at E10.5 (34 and 35 sp). Cluster gate cells (box in left panel) are shown as green dots in the right panel. Expression of CD41 in the cluster gate is lower than in the CD41hi megakaryocyte lineage (red dotted box, see Fig. S8 in the supplementary material).
Fig. 9.
Fig. 9.
Three-dimensional imaging of surface marker expression in mouse hematopoietic clusters Confocal analysis of CD41 expression at E10.5 (36 sp). (A-D) Images showing CD41 high and low expressing cells. Movie 6 in the supplementary material shows a 3D reconstruction. CD41hi cells (megakaryocytes and platelets) circulating in aorta and small vessels. Consistent with FACS-based prediction shown in Fig. 8D, CD41 expression is lower in cluster cells than in magakaryocytic lineage. Arrowheads in B and C indicate clusters. Scale bar: 100 μm. (D) Magnification of the boxed region in C. (E-H) Expression of CD31, CD41 and CD45 in hematopoietic cluster at E10.5 (35 sp). CD41 expression was detected in the basal and other cells throughout cluster. A CD31+CD41lo cell (arrowheads in E-G) with a semi-circular shape is negative for CD45. Scale bar: 20 μm.
Fig. 10.
Fig. 10.
Functional analyses of enriched mouse hematopoietic cluster cells. (A) FACS profile of the caudal half region, VA and UA cells at E10 (31-34) sp. SSEA1 cells were sorted into four populations: R1 (endothelial cells, 0.37±0.12%), R2 (hematopoietic clusters, 0.081±0.009%), R3 (0.10±0.03%) and R4 (75.5±6.0%). (B) Methylcellulose colony-forming assay of sorted cells from 31-34 sp embryos. CFU-GEMM, CFU-G/M/GM and BFU-E were counted after 7-8 days of culture. Results are mean ± s.d. of three independent experiments. (C) HSC activity in hematopoietic clusters. *Secondary repopulation was also observed. **AGM equivalent. VA, vitelline artery; UA, umbilical artery; PB, peripheral blood. (D) Representative hematopoietic multi-lineage FACS profile of long-term reconstituted mice. Peripheral blood was analyzed 4 months post-injection.

Similar articles

Cited by

References

    1. Adamo L., Naveiras O., Wenzel P. L., McKinney-Freeman S., Mack P. J., Gracia-Sancho J., Suchy-Dicey A., Yoshimoto M., Lensch M. W., Yoder M. C., et al. (2009). Biomechanical forces promote embryonic haematopoiesis. Nature 459, 1131-1135 - PMC - PubMed
    1. Bertrand J. Y., Chi N. C., Santoso B., Teng S., Stainier D. Y., Traver D. (2010). Haematopoietic stem cells derive directly from aortic endothelium during development. Nature 464, 108-111 - PMC - PubMed
    1. Boisset J. C., van Cappellen W., Andrieu-Soler C., Galjart N., Dzierzak E., Robin C. (2010). In vivo imaging of haematopoietic cells emerging from the mouse aortic endothelium. Nature 464, 116-120 - PubMed
    1. Cai Z., de Bruijn M., Ma X., Dortland B., Luteijn T., Downing R. J., Dzierzak E. (2000). Haploinsufficiency of AML1 affects the temporal and spatial generation of hematopoietic stem cells in the mouse embryo. Immunity 13, 423-431 - PubMed
    1. Chen M. J., Yokomizo T., Zeigler B. M., Dzierzak E., Speck N. A. (2009). Runx1 is required for the endothelial to haematopoietic cell transition but not thereafter. Nature 457, 887-891 - PMC - PubMed

Publication types

MeSH terms