

Analysis of randomized comparative clinical trial data for personalized treatment selections
- PMID: 20876663
- PMCID: PMC3062150
- DOI: 10.1093/biostatistics/kxq060
Analysis of randomized comparative clinical trial data for personalized treatment selections
Abstract
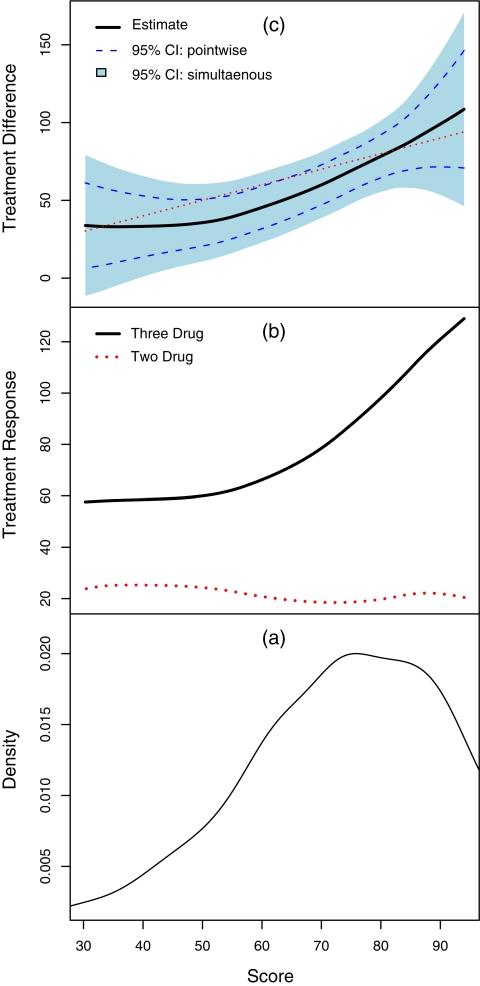
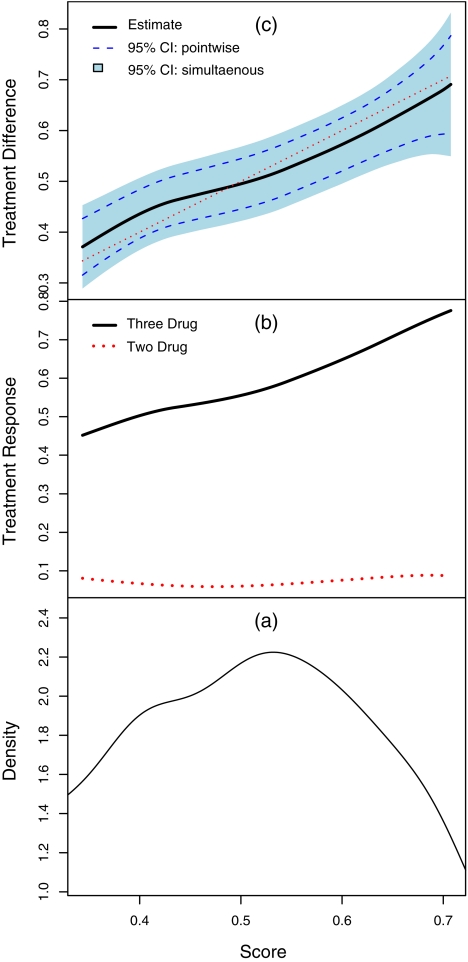
Suppose that under the conventional randomized clinical trial setting, a new therapy is compared with a standard treatment. In this article, we propose a systematic, 2-stage estimation procedure for the subject-level treatment differences for future patient's disease management and treatment selections. To construct this procedure, we first utilize a parametric or semiparametric method to estimate individual-level treatment differences, and use these estimates to create an index scoring system for grouping patients. We then consistently estimate the average treatment difference for each subgroup of subjects via a nonparametric function estimation method. Furthermore, pointwise and simultaneous interval estimates are constructed to make inferences about such subgroup-specific treatment differences. The new proposal is illustrated with the data from a clinical trial for evaluating the efficacy and toxicity of a 3-drug combination versus a standard 2-drug combination for treating HIV-1-infected patients.
Figures
References
-
- Bonetti M, Gelber RD. A graphical method to assess treatment-covariate interactions using the cox model on subsets of the data. Statistics in Medicine. 2000;19:2595–2609. - PubMed
-
- Bonetti M, Gelber RD. Patterns of treatment effects in subsets of patients in clinical trials. Biostatistics. 2005;5:465–481. - PubMed
-
- Bowman A, Hall P, Prvan T. Bandwidth selection for the smoothing of distribution functions. Biometrika. 1998;85:799–808.
-
- Byar DP. Assessing apparent treatment: covariate interactions in randomized clinical trials. Statistics in Medicine. 1985;4:255–263. - PubMed
-
- Fan J, Gijbels I. Monographs on Statistics and Applied Probability. Volume 66. London: Chapman Hall; 1996. Local polynomial modelling and its applications.
Publication types
MeSH terms
Substances
Grants and funding
LinkOut - more resources
Full Text Sources
